About:
Here you will find a description of the organization and functionality of the different
components of the main SKMATLAS analysis page.
Since the database provides two methods of analysis, the analysis page is divided into two types.
Related Network:
The SKMATLAS analysis page of related network consists mainly of 3 sections that warrant
descriptions.Figure 1 shows the different sections of the SKMATLAS analysis page of related
network with their respective components.
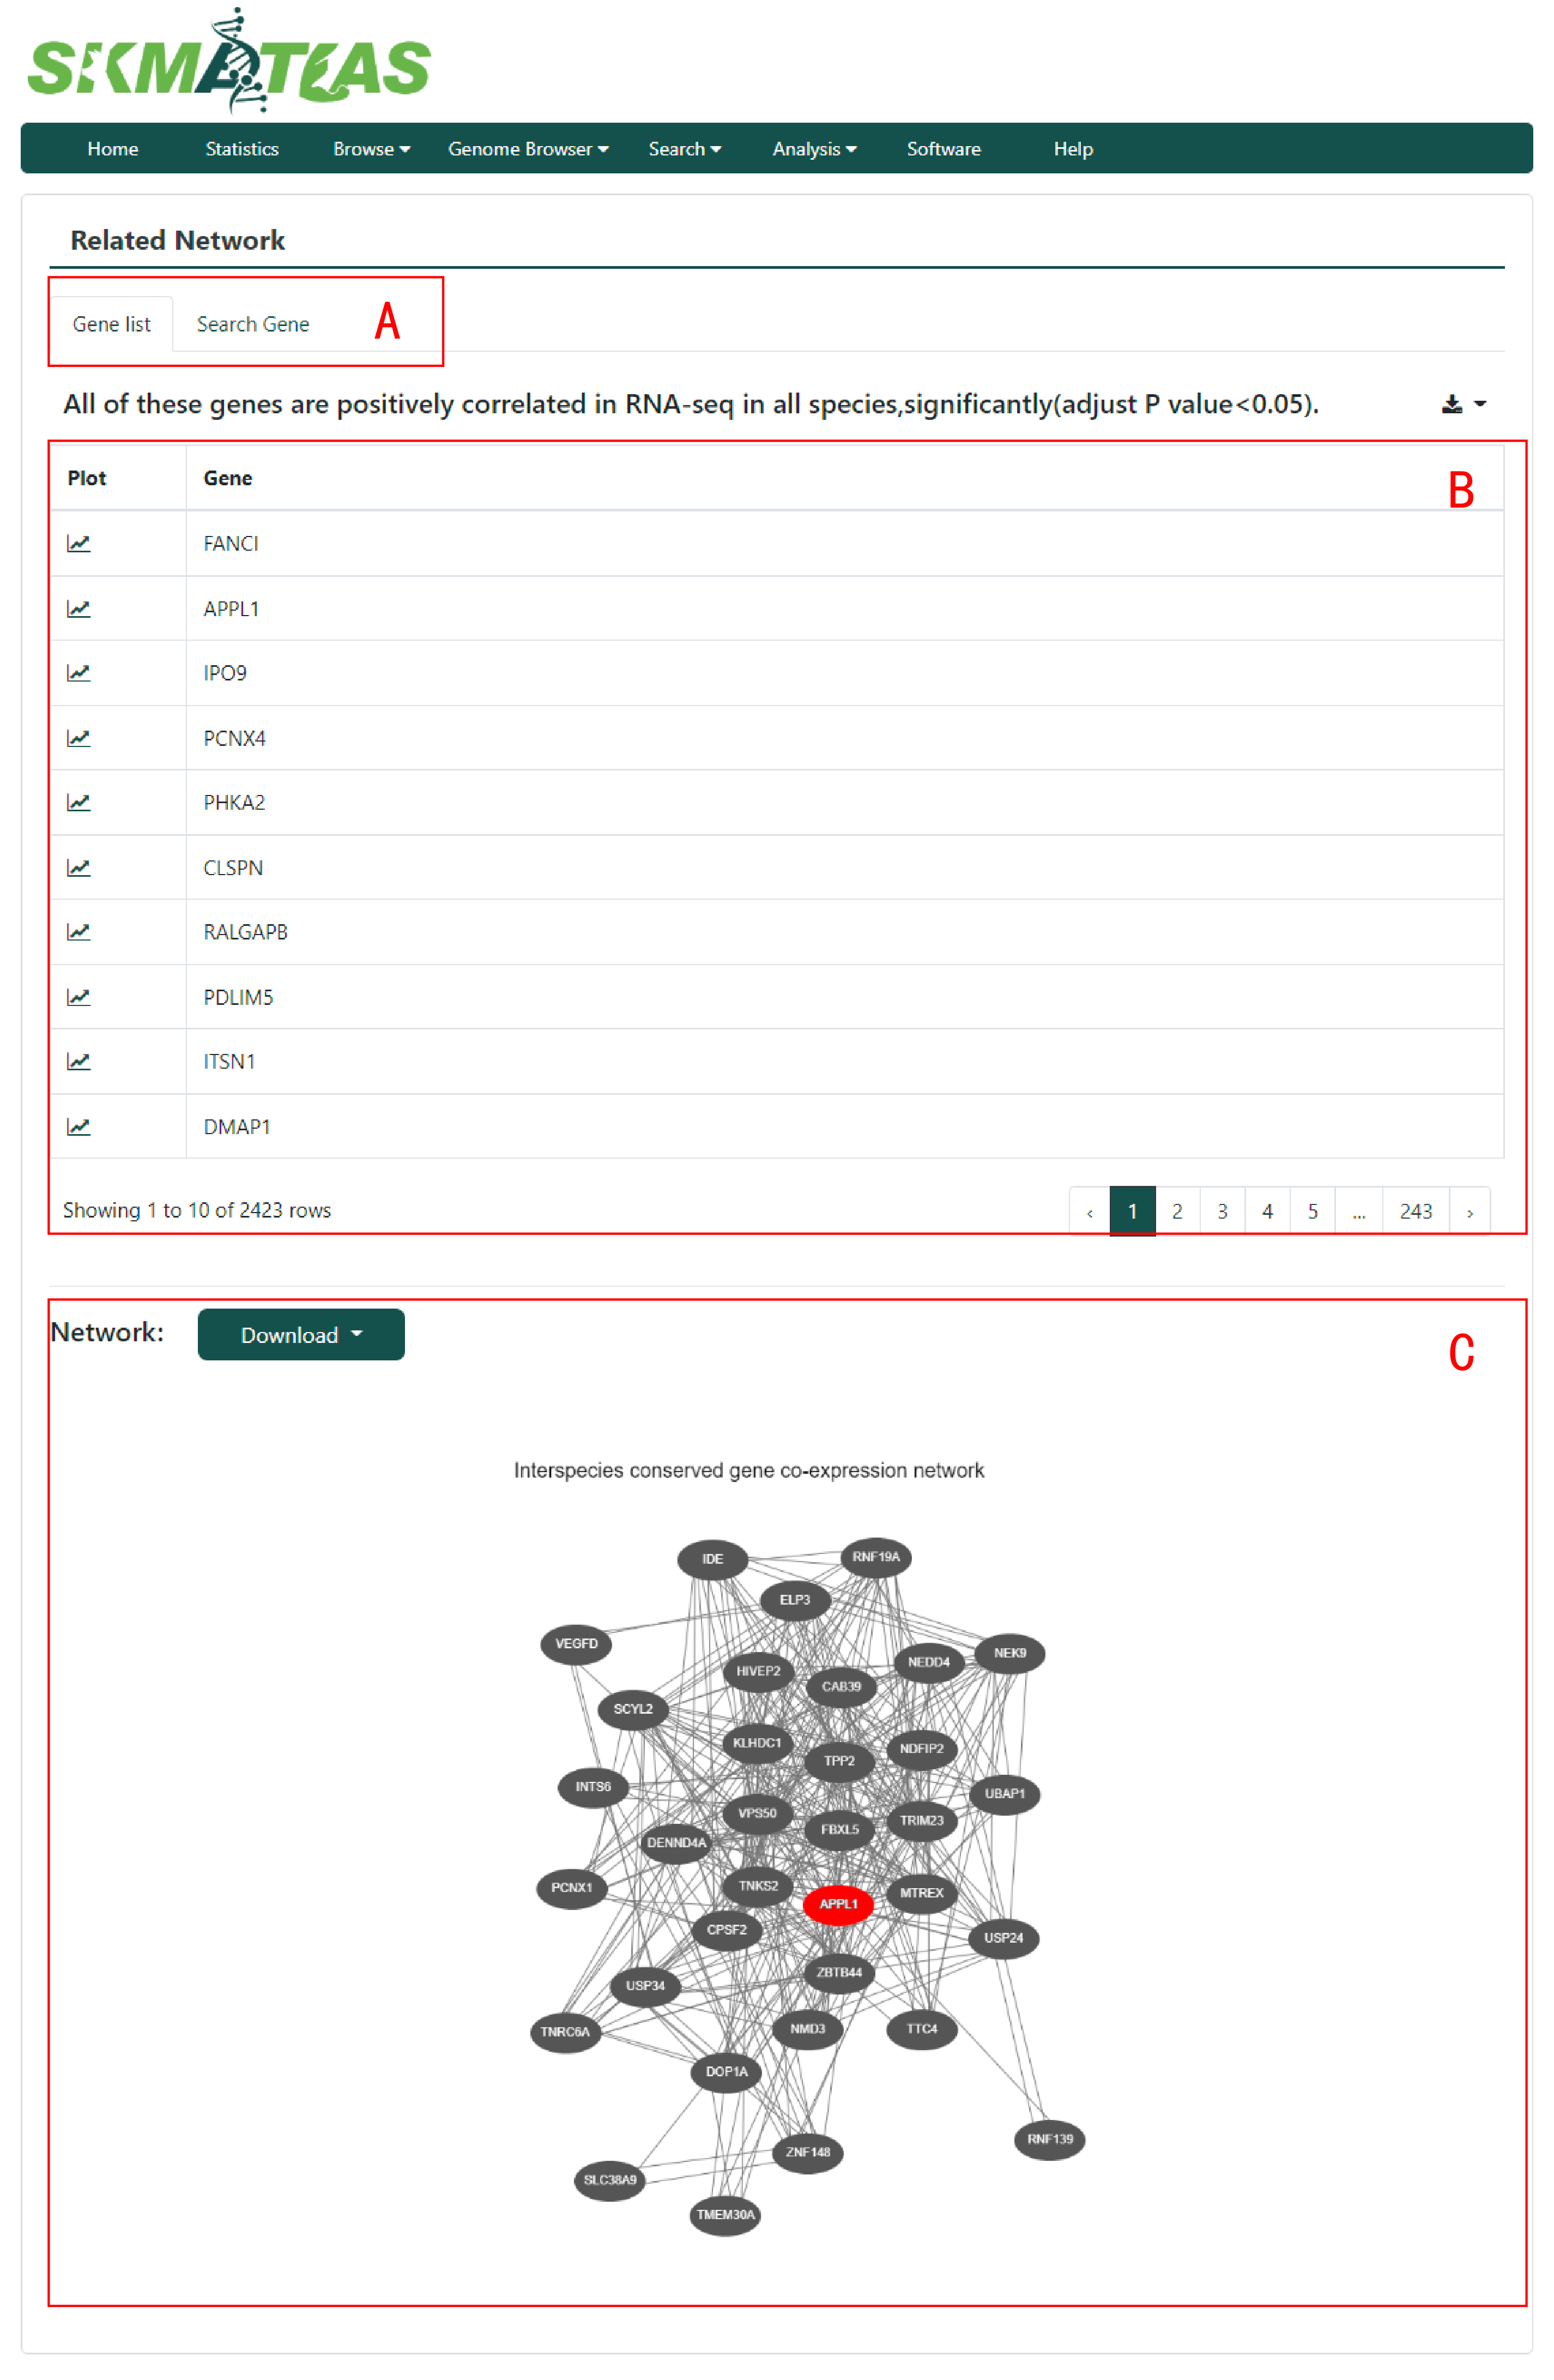
Figure 1.SKMATLAS analysis page of related Network. The page is organized in
3 main sections: A. Navigation bar. B.Table of gene list. C.Network of related network.
Each section is described separately below.
A: Navigation bar
This section (Figure 1A) covers the navigation bar, which includes the following two tabs:
The Gene list tab
In this tab, the analysis page shows one table(Figure 1B) and one plot(Figure 1C).
The table lists all genes selected by our standard process. All of these genes are positively correlated
in RNA-seq in all species, significantly(adjust p-value<0.05 in all species). The plot column links to
the network plot(Figure 1C) which shows a relevant network of all genes associated with this gene.
The search Gene tab
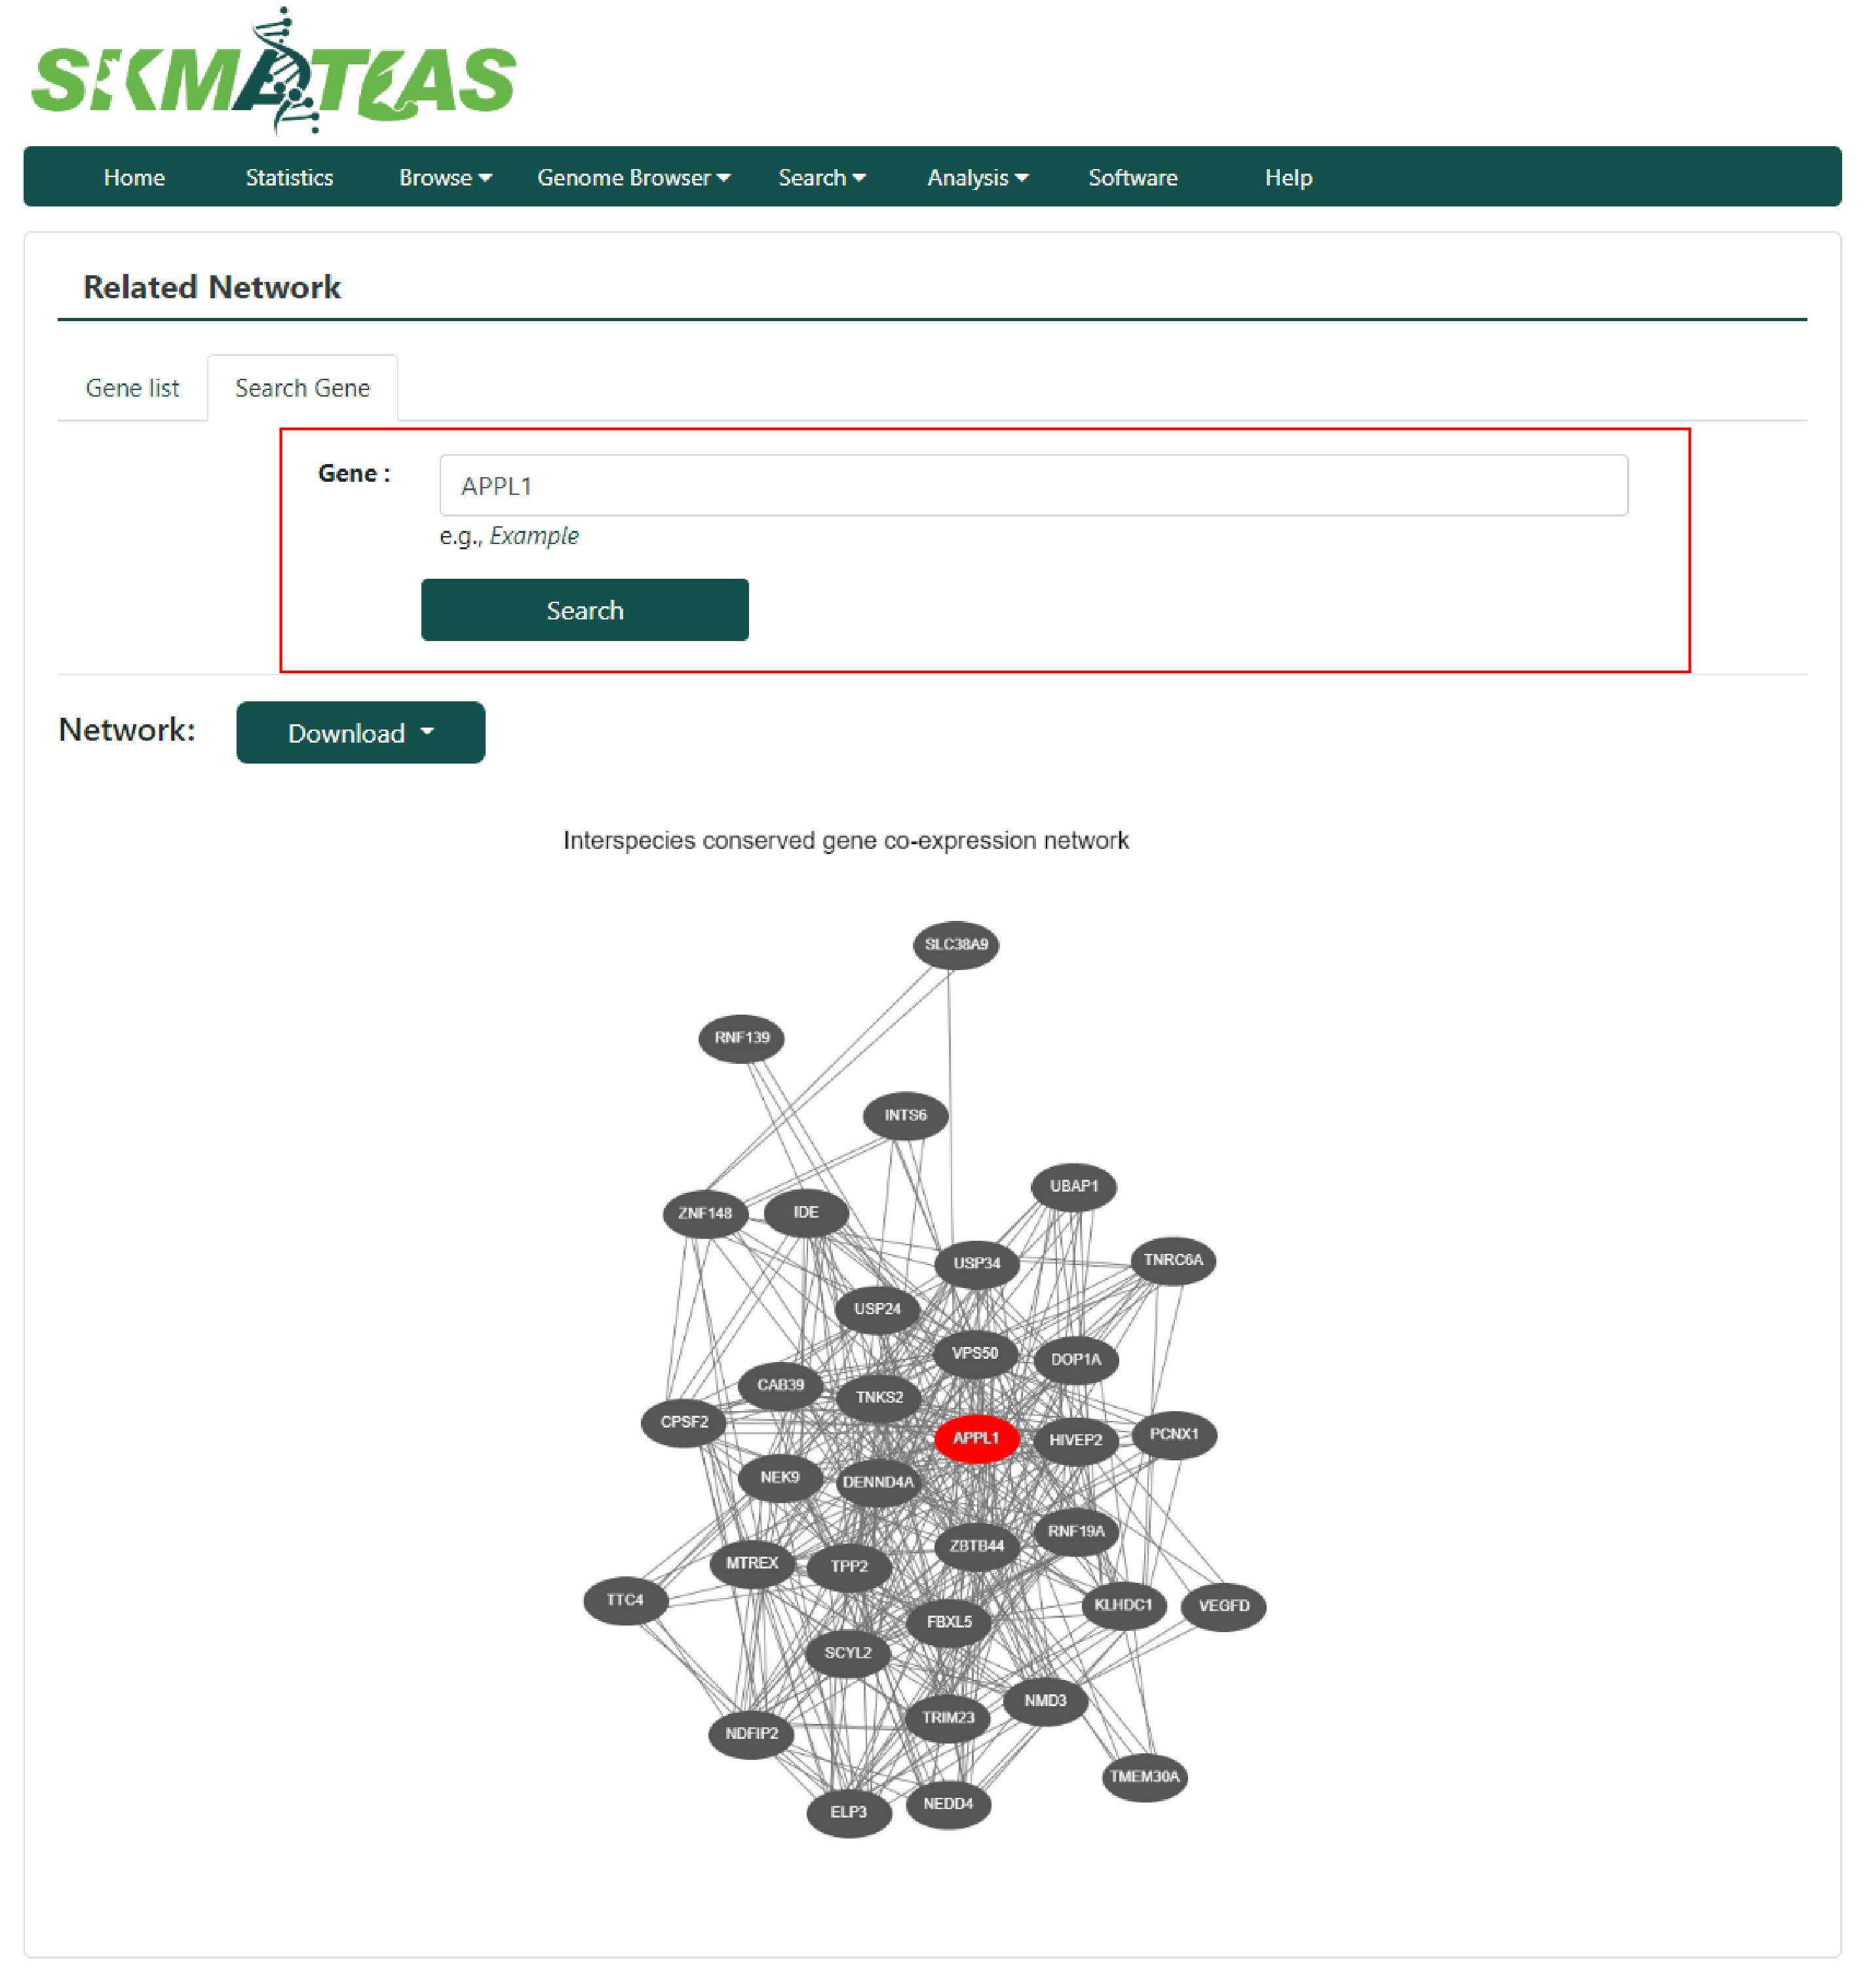
Figure 2. Search a gene to show a related network of all genes associated with this gene.
Using search box to search a gene then a related network of all genes associated with this gene showed blow the search box.
Do Heatmap:
There are five ways to draw a heat map.
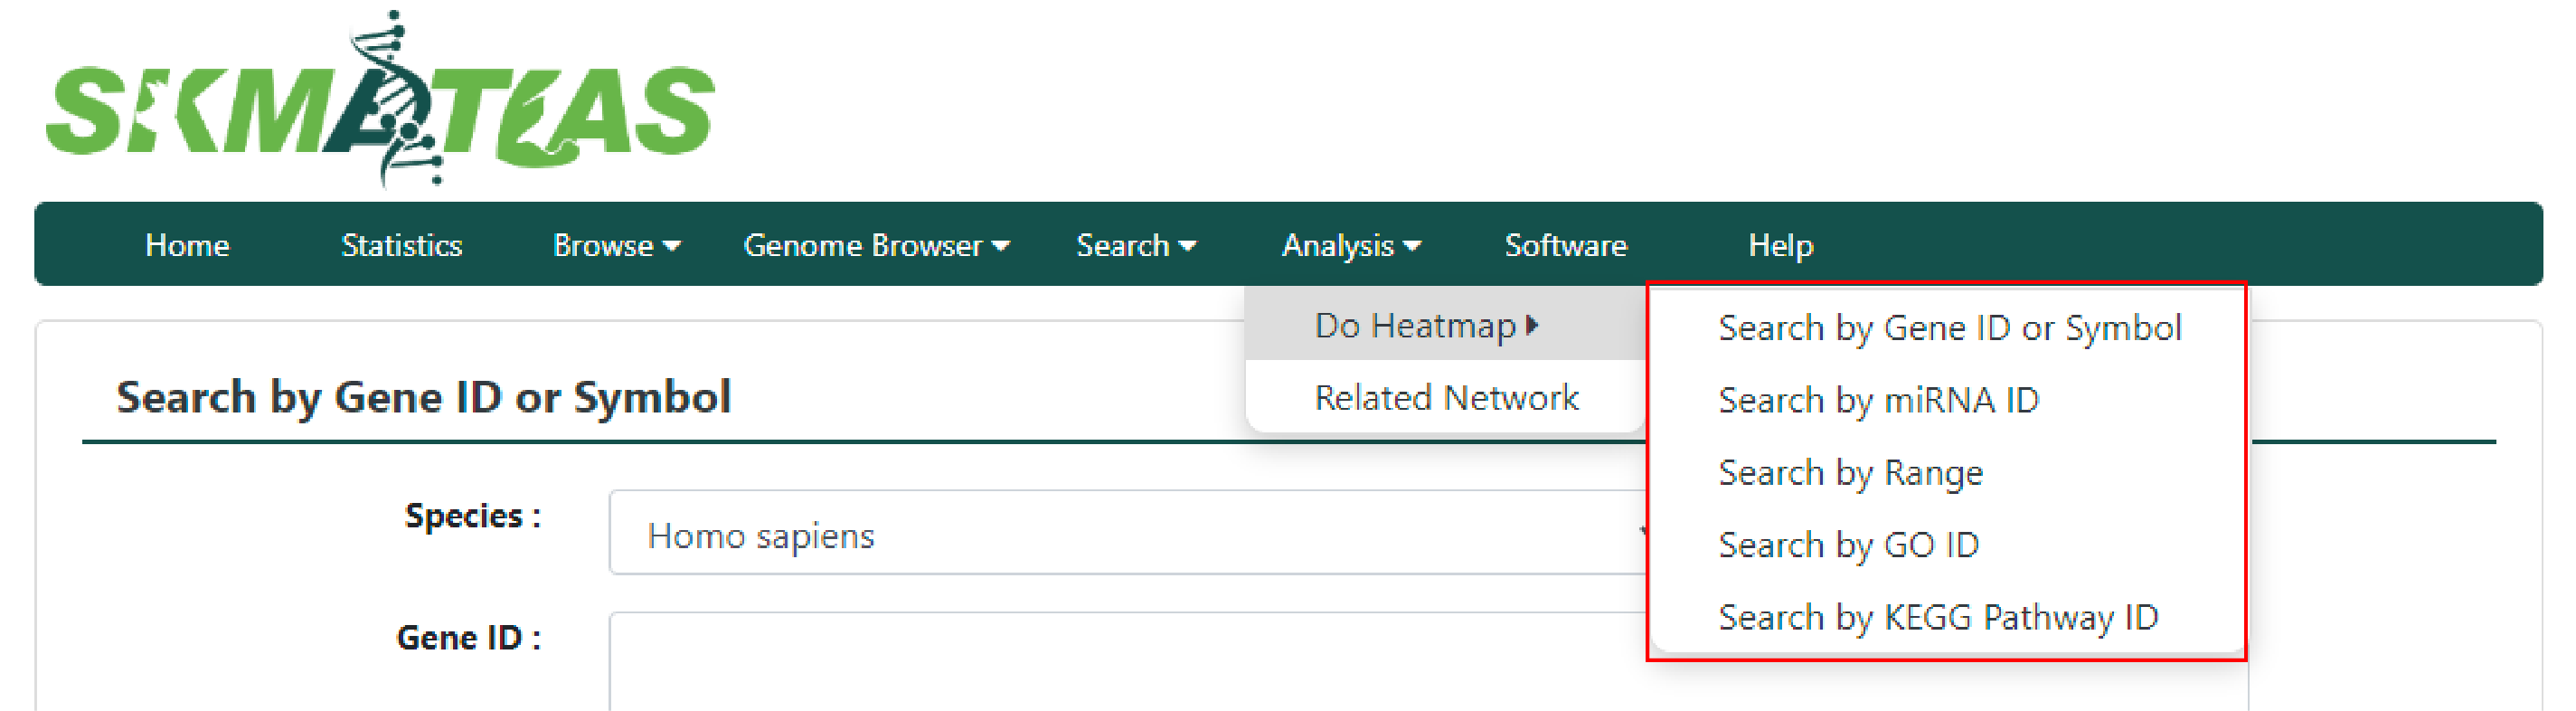
Figure 3. Five ways to draw a heat map.
The SKMATLAS analysis page of Do Heatmap consists mainly of 3 sections that warrant
descriptions.Figure 3 shows the different sections of the SKMATLAS analysis page of related network with
their respective components.
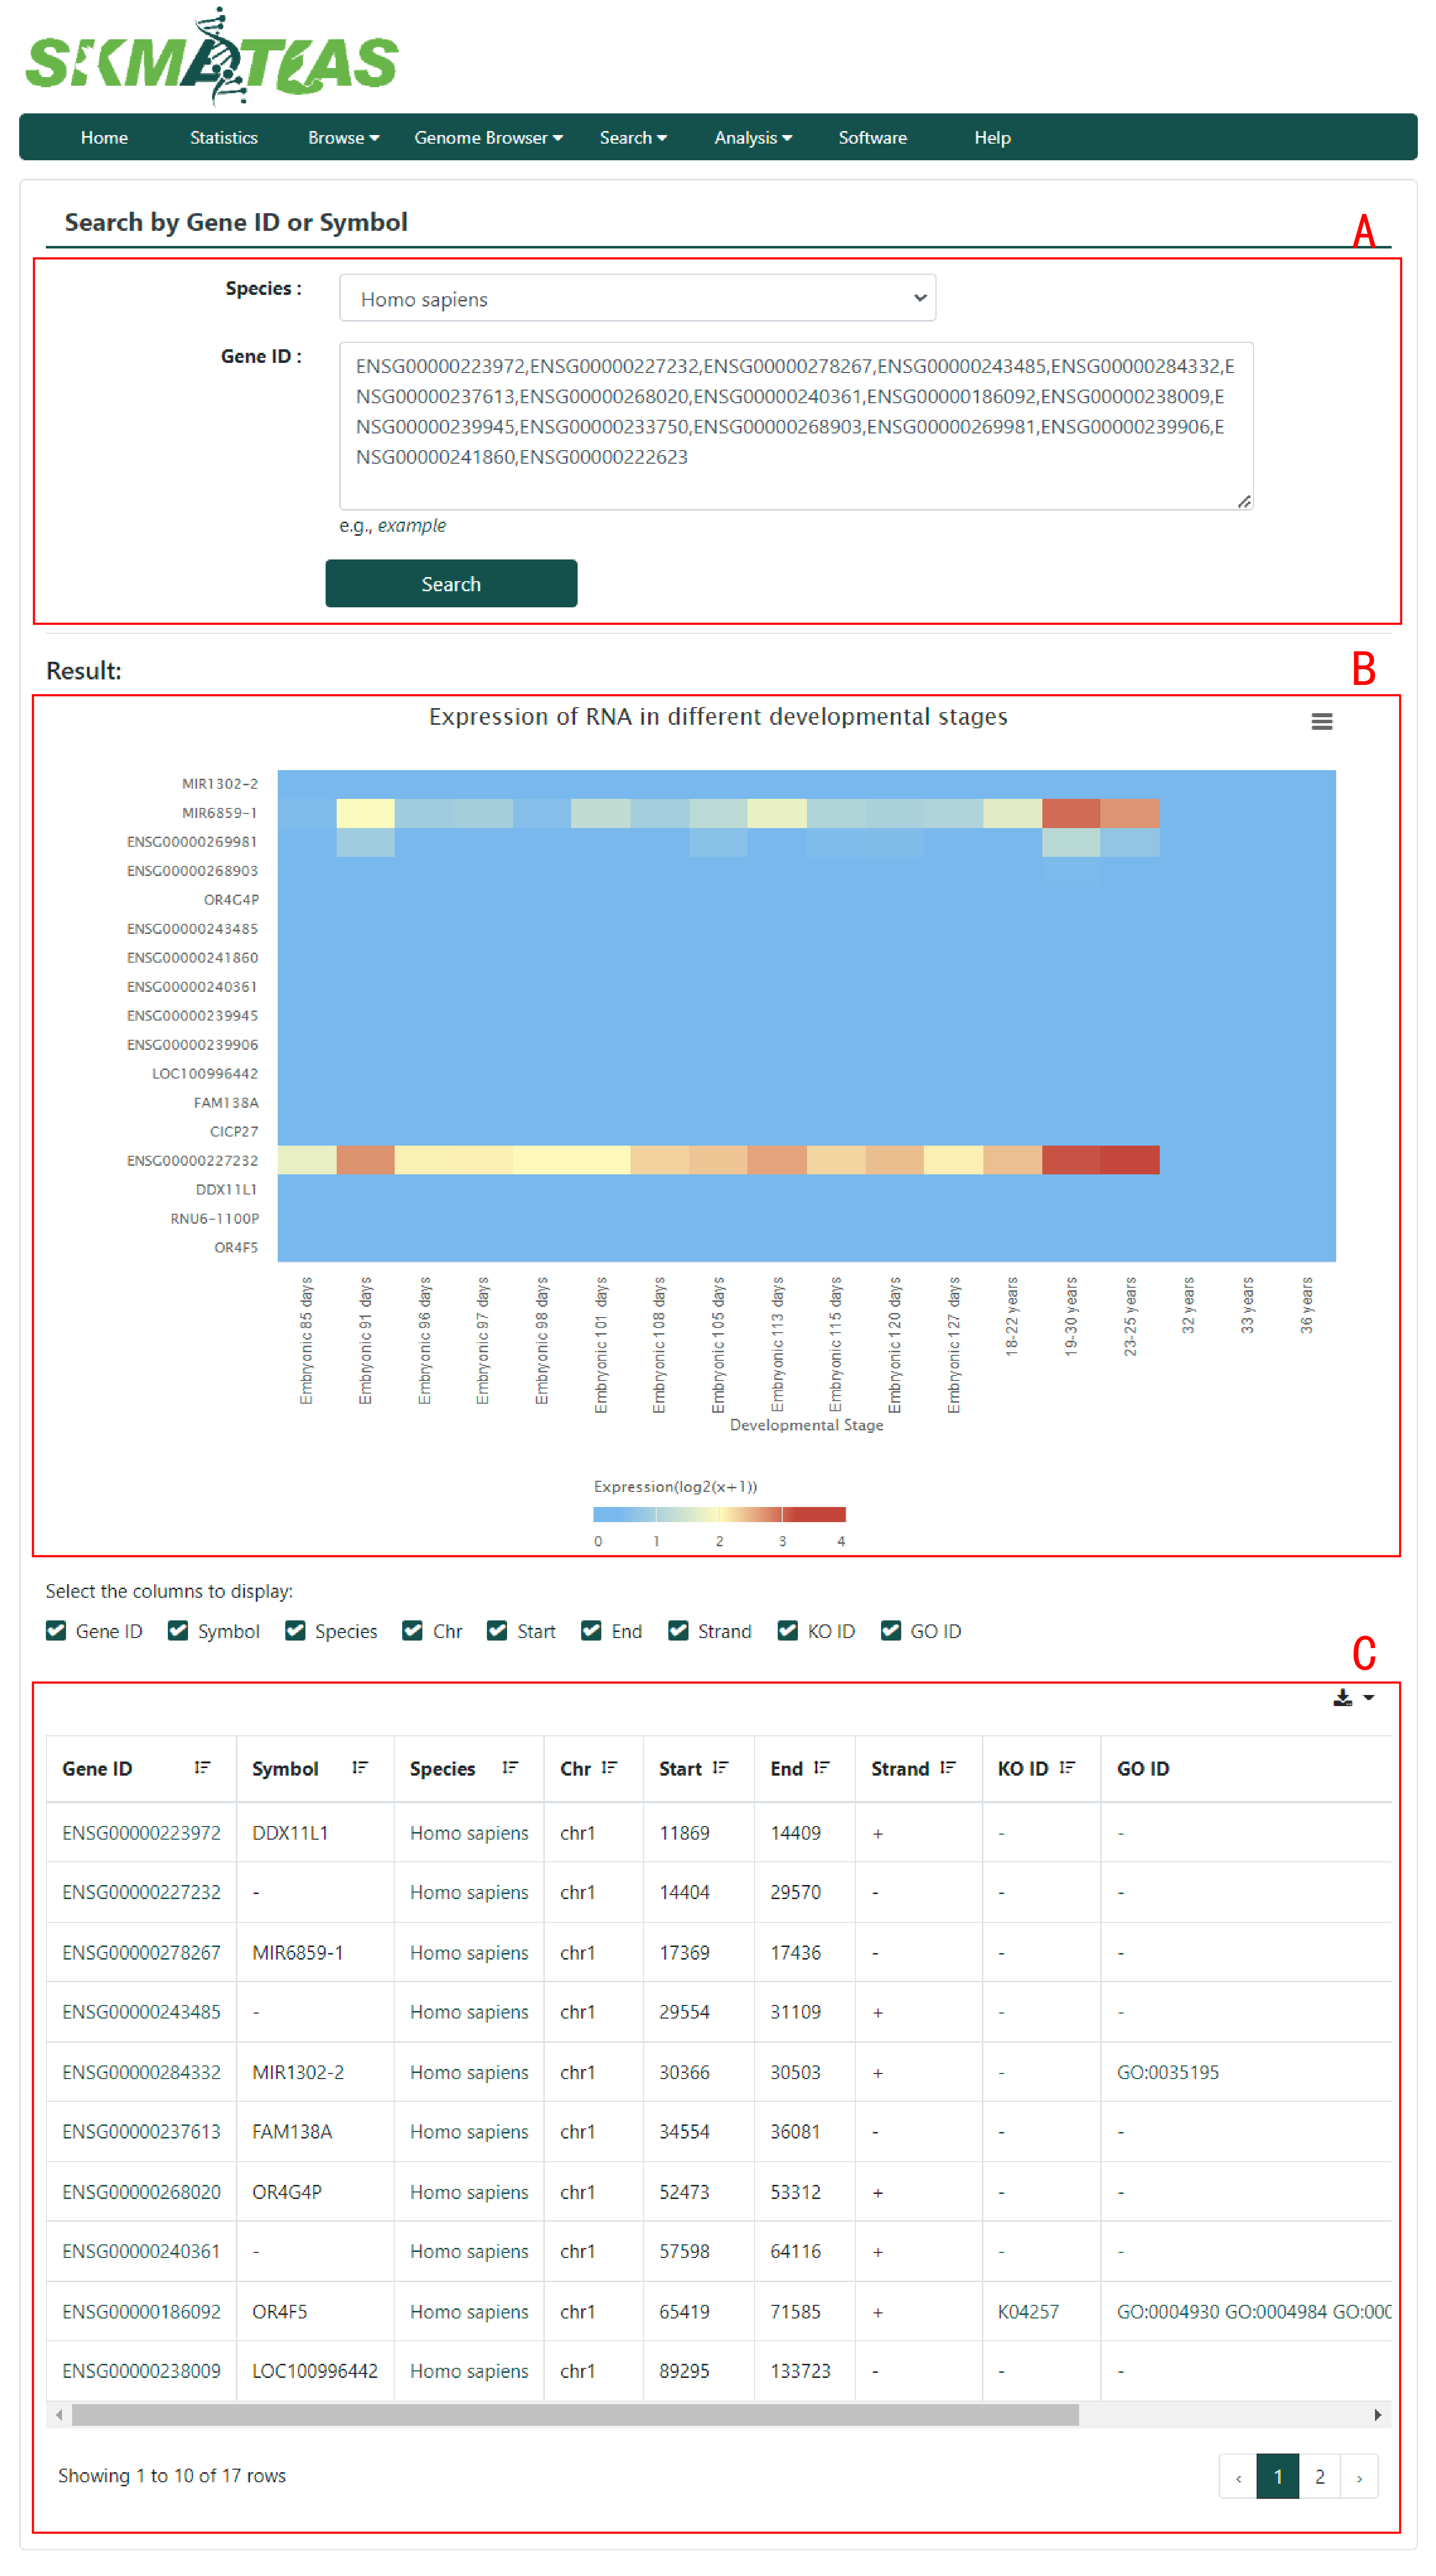
Figure 4.SKMATLAS analysis page of Do Heatmap. In different ways to draw the heat
map, the layout of the pages is the same which organized in 3 main sections: A. Search box. B.Heat map. C.Table of Gene.
Each section is described separately below.
Search by Gene ID or Symbol
A.Select a specie and input a list of gene split by “,”
B.In this heat map, The x-axis is sorted in chronological order of development
and the y-axis genes inputted in search box and the color of cell represents the amount of expression.
C.Table of genes inputted in search box
Search by miRNA ID
A.Select a specie and input a miRNA ID
B.In this heat map, the x-axis is sorted in chronological order of development
and the y-axis is target genes for this miRNA and the color of cell represents the amount of expression.
C.Table of target genes for this miRNA
Search by Range
A.Select a specie and locate a chromosome range
B.In this heat map, the x-axis is sorted in chronological order of development
and the y-axis is genes in this GO term&KEGG pathway and the color of cell represents the amount of expression.
C.Table of genes in this GO term&KEGG pathway.