About:
Here you will know detail information and data of multi-omics about a gene in the main
SKMATLAS genepage.
The SKMATLAS genepage consists mainly of 3 sections that warrant descriptions. Figure 1 shows the different sections of the SKMATLAS genepage with their respective components.
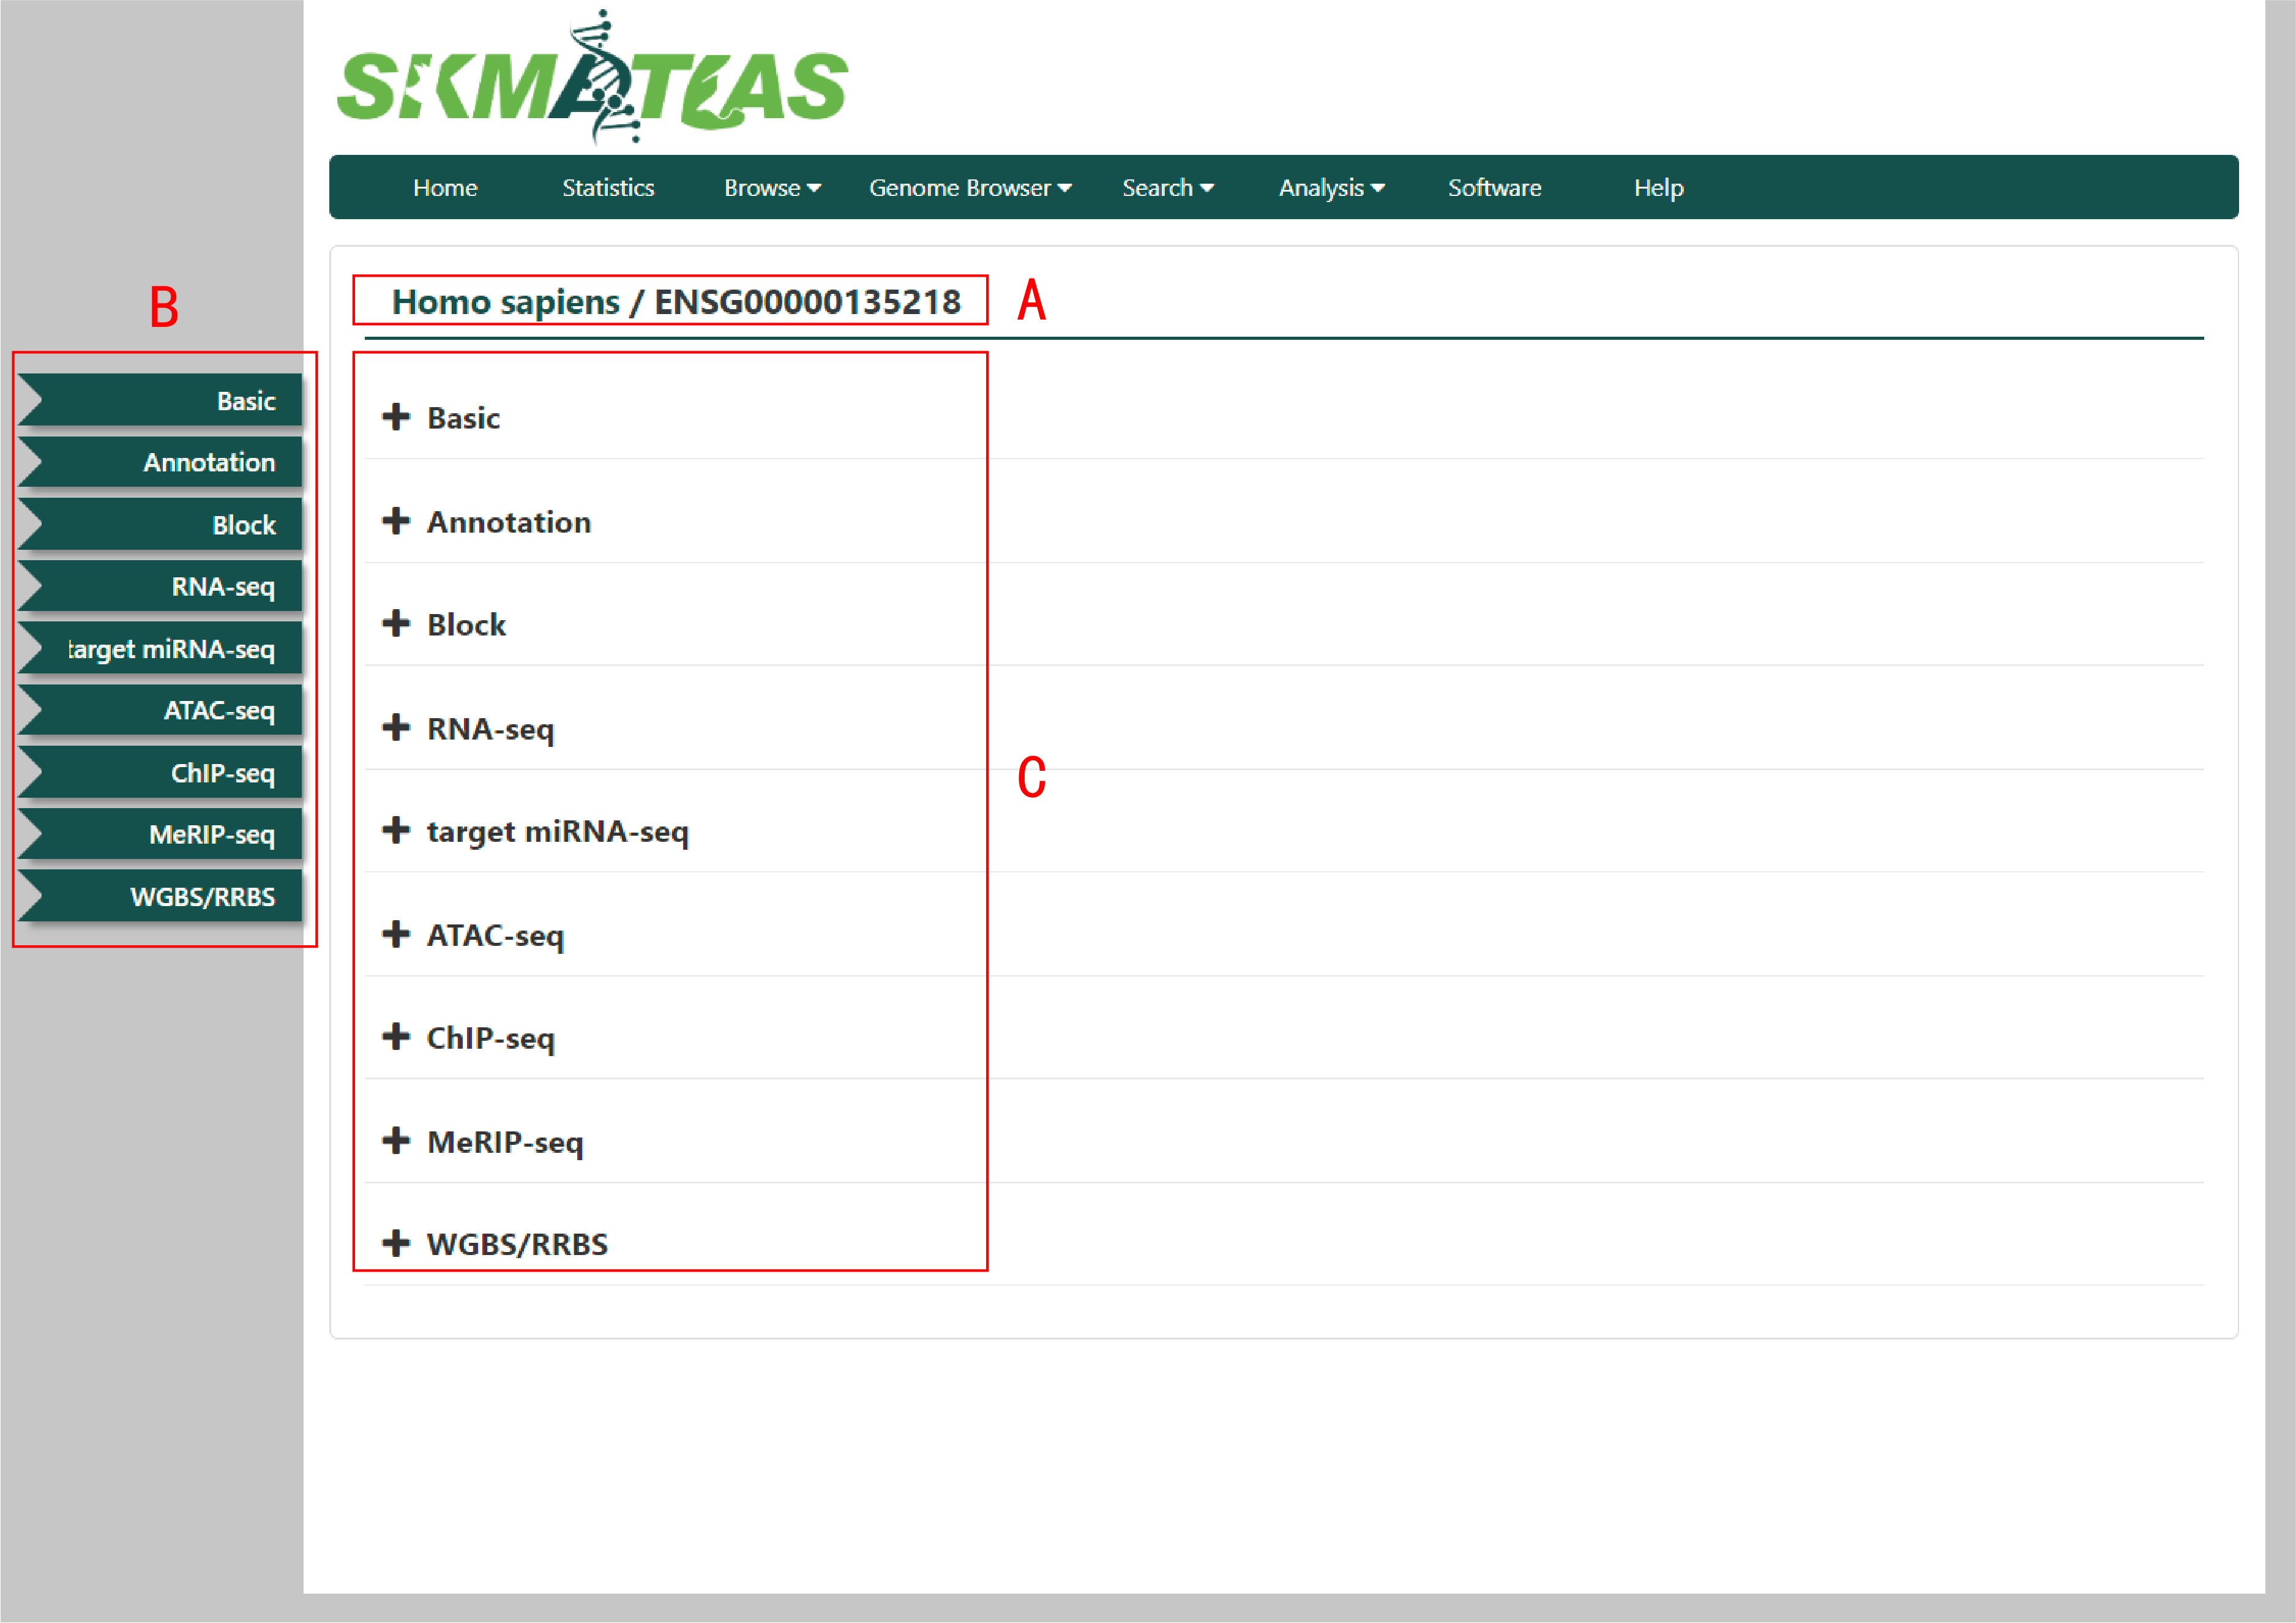
Figure 1. Components of the SKMATLAS genepage. The page is organized in 3 main sections: A. Specie and Gene ID. B.Side navigation bar. C. Body of page including information and Multi-omics data of this gene.
Each section is described separately below.
A: Information and gene ID of this gene.
B: Side navigation bar. Click the same bar as in the Body header to jump to the appropriate location on the Body of page(Figure 1C) when the Body of page(Figure 1C) expands.
C: Body of page.
This section (Figure 1A) covers the Body of page, which includes the following nine parts:
Basic
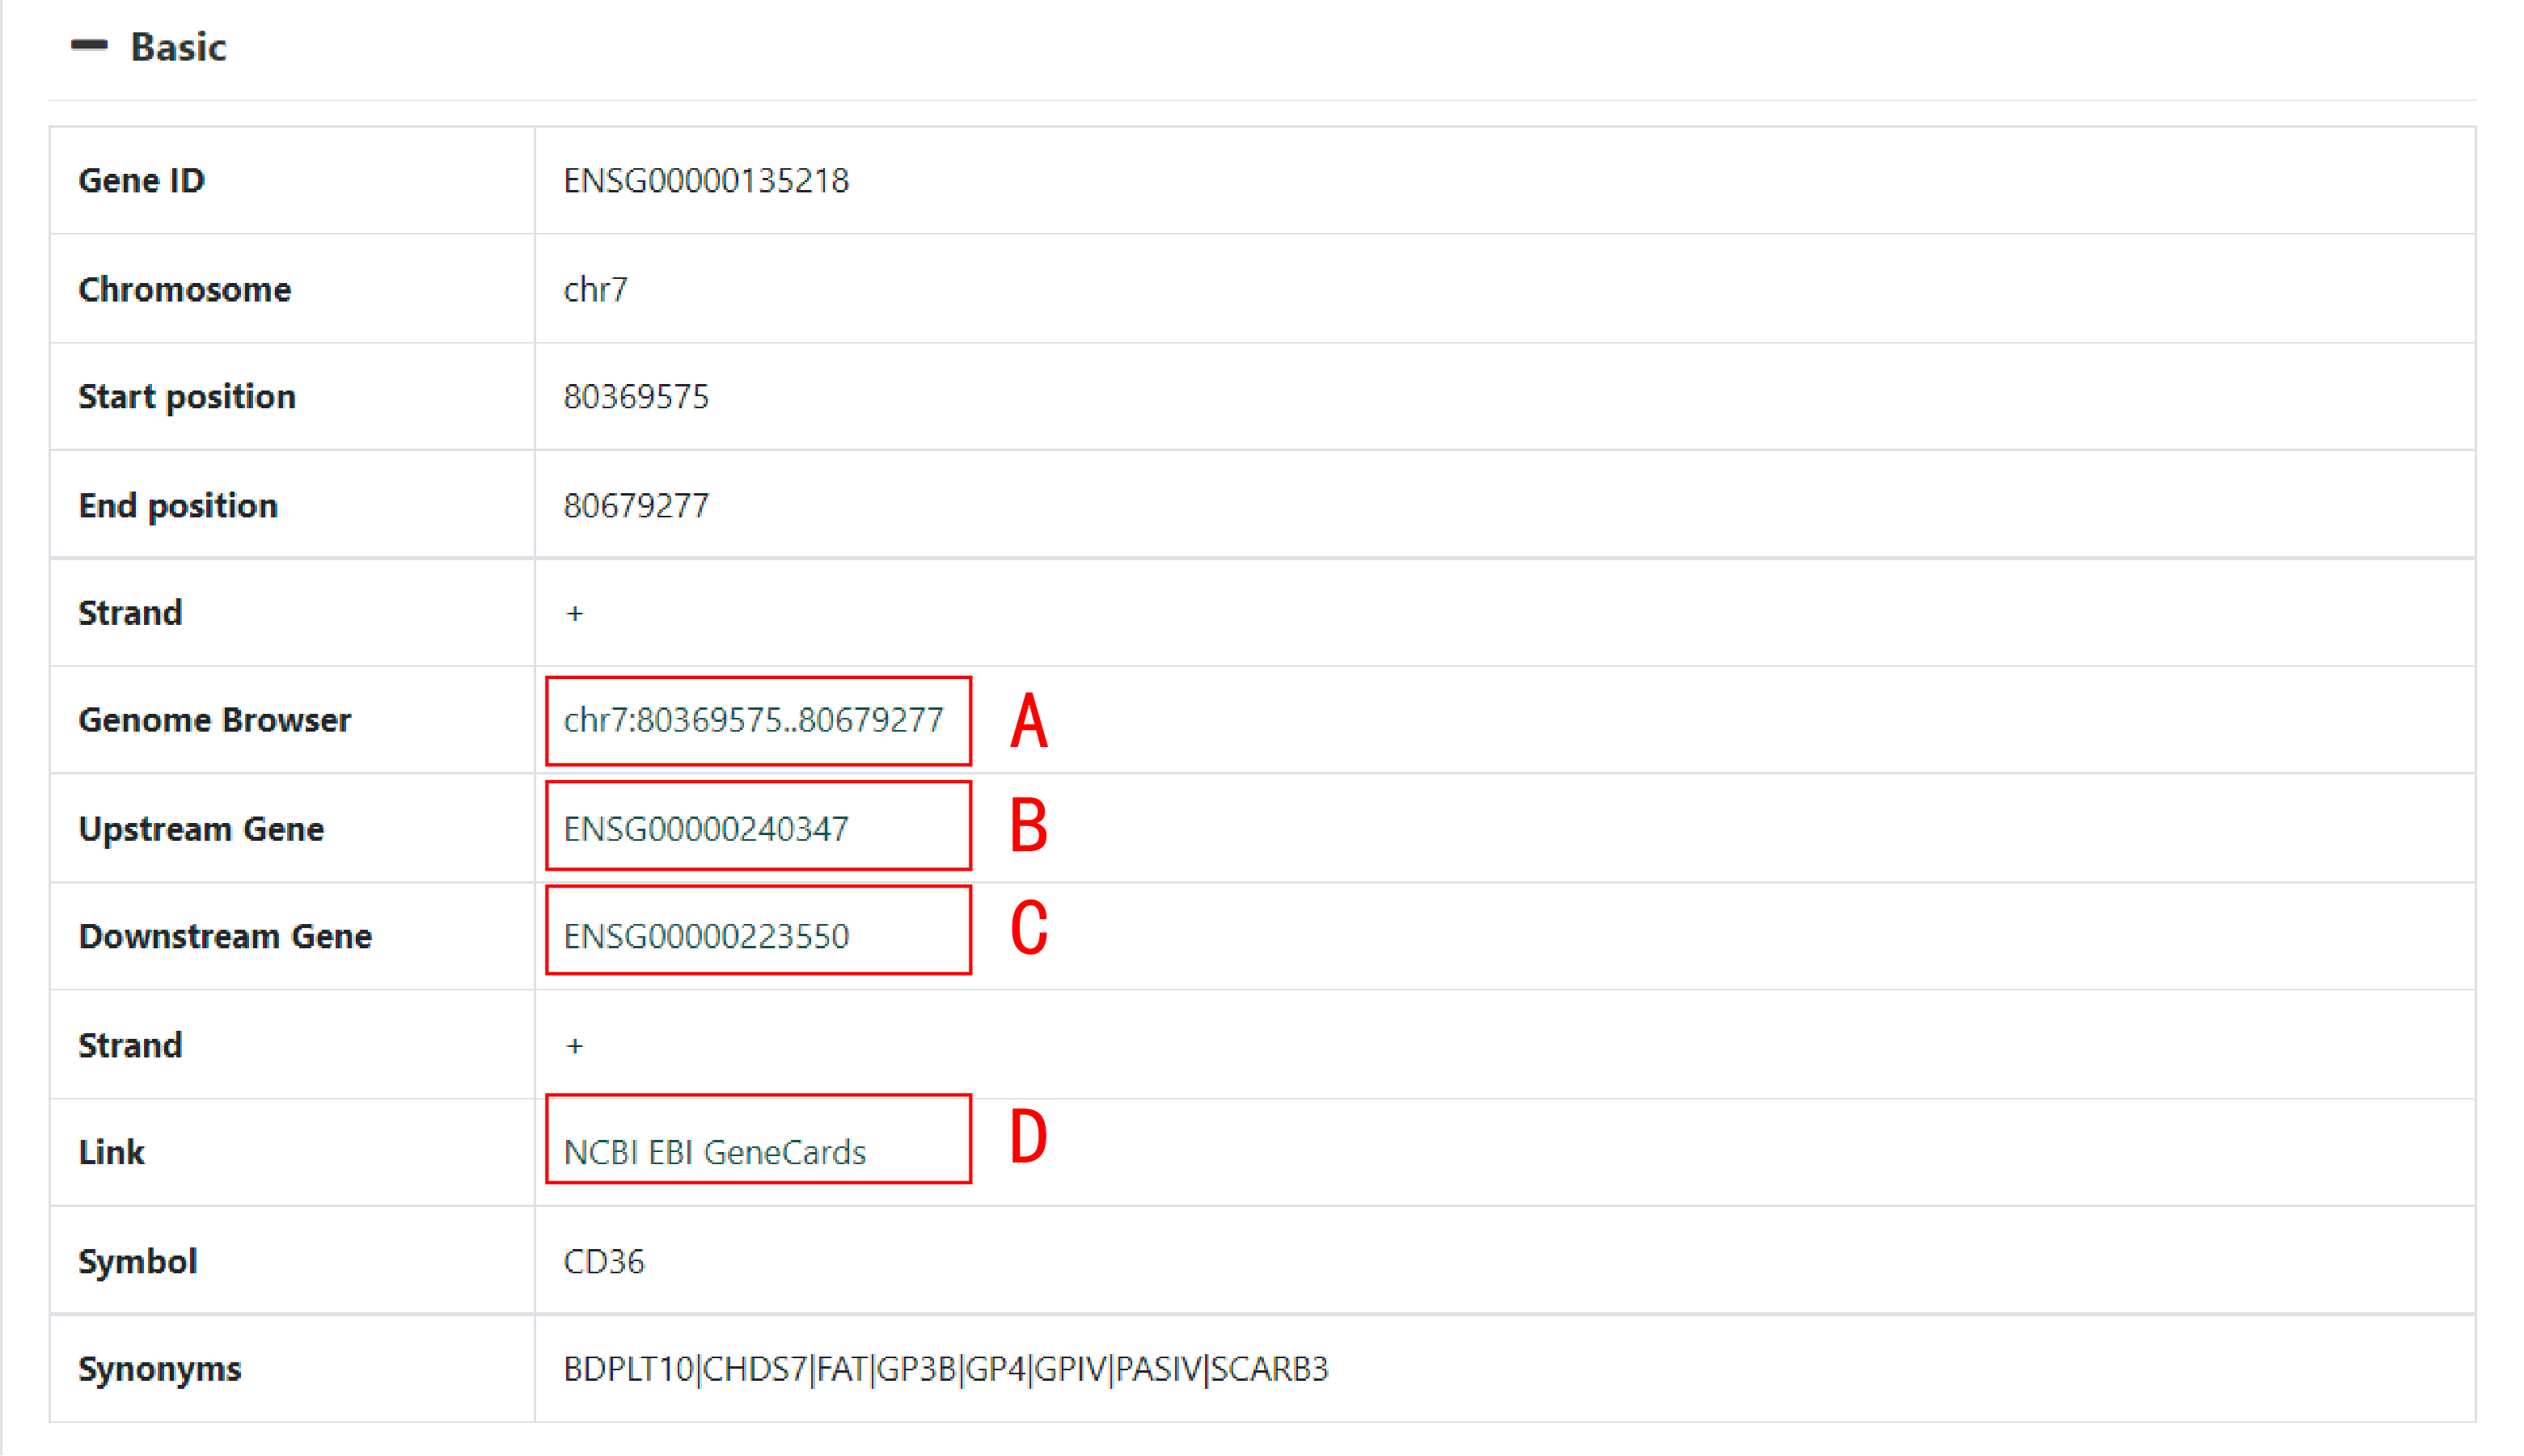
Figure 2. Gene basic information
This part includes basic information of this gene. In addition to containing basic information from the reference genome, it contains some additional information and links to other databases. Genome Browser(Figure 2A) links to Genome browser page of this specie window of which locates the gene in the genome.
Upstream Gene(Figure 2B) links to upstream gene of this genepage Downstream Gene(Figure 2C) is same as Upstream Gene(Figure 2B)
Link(Figure 2D) links to NCBI, EBI, Gene card database.
Annotation
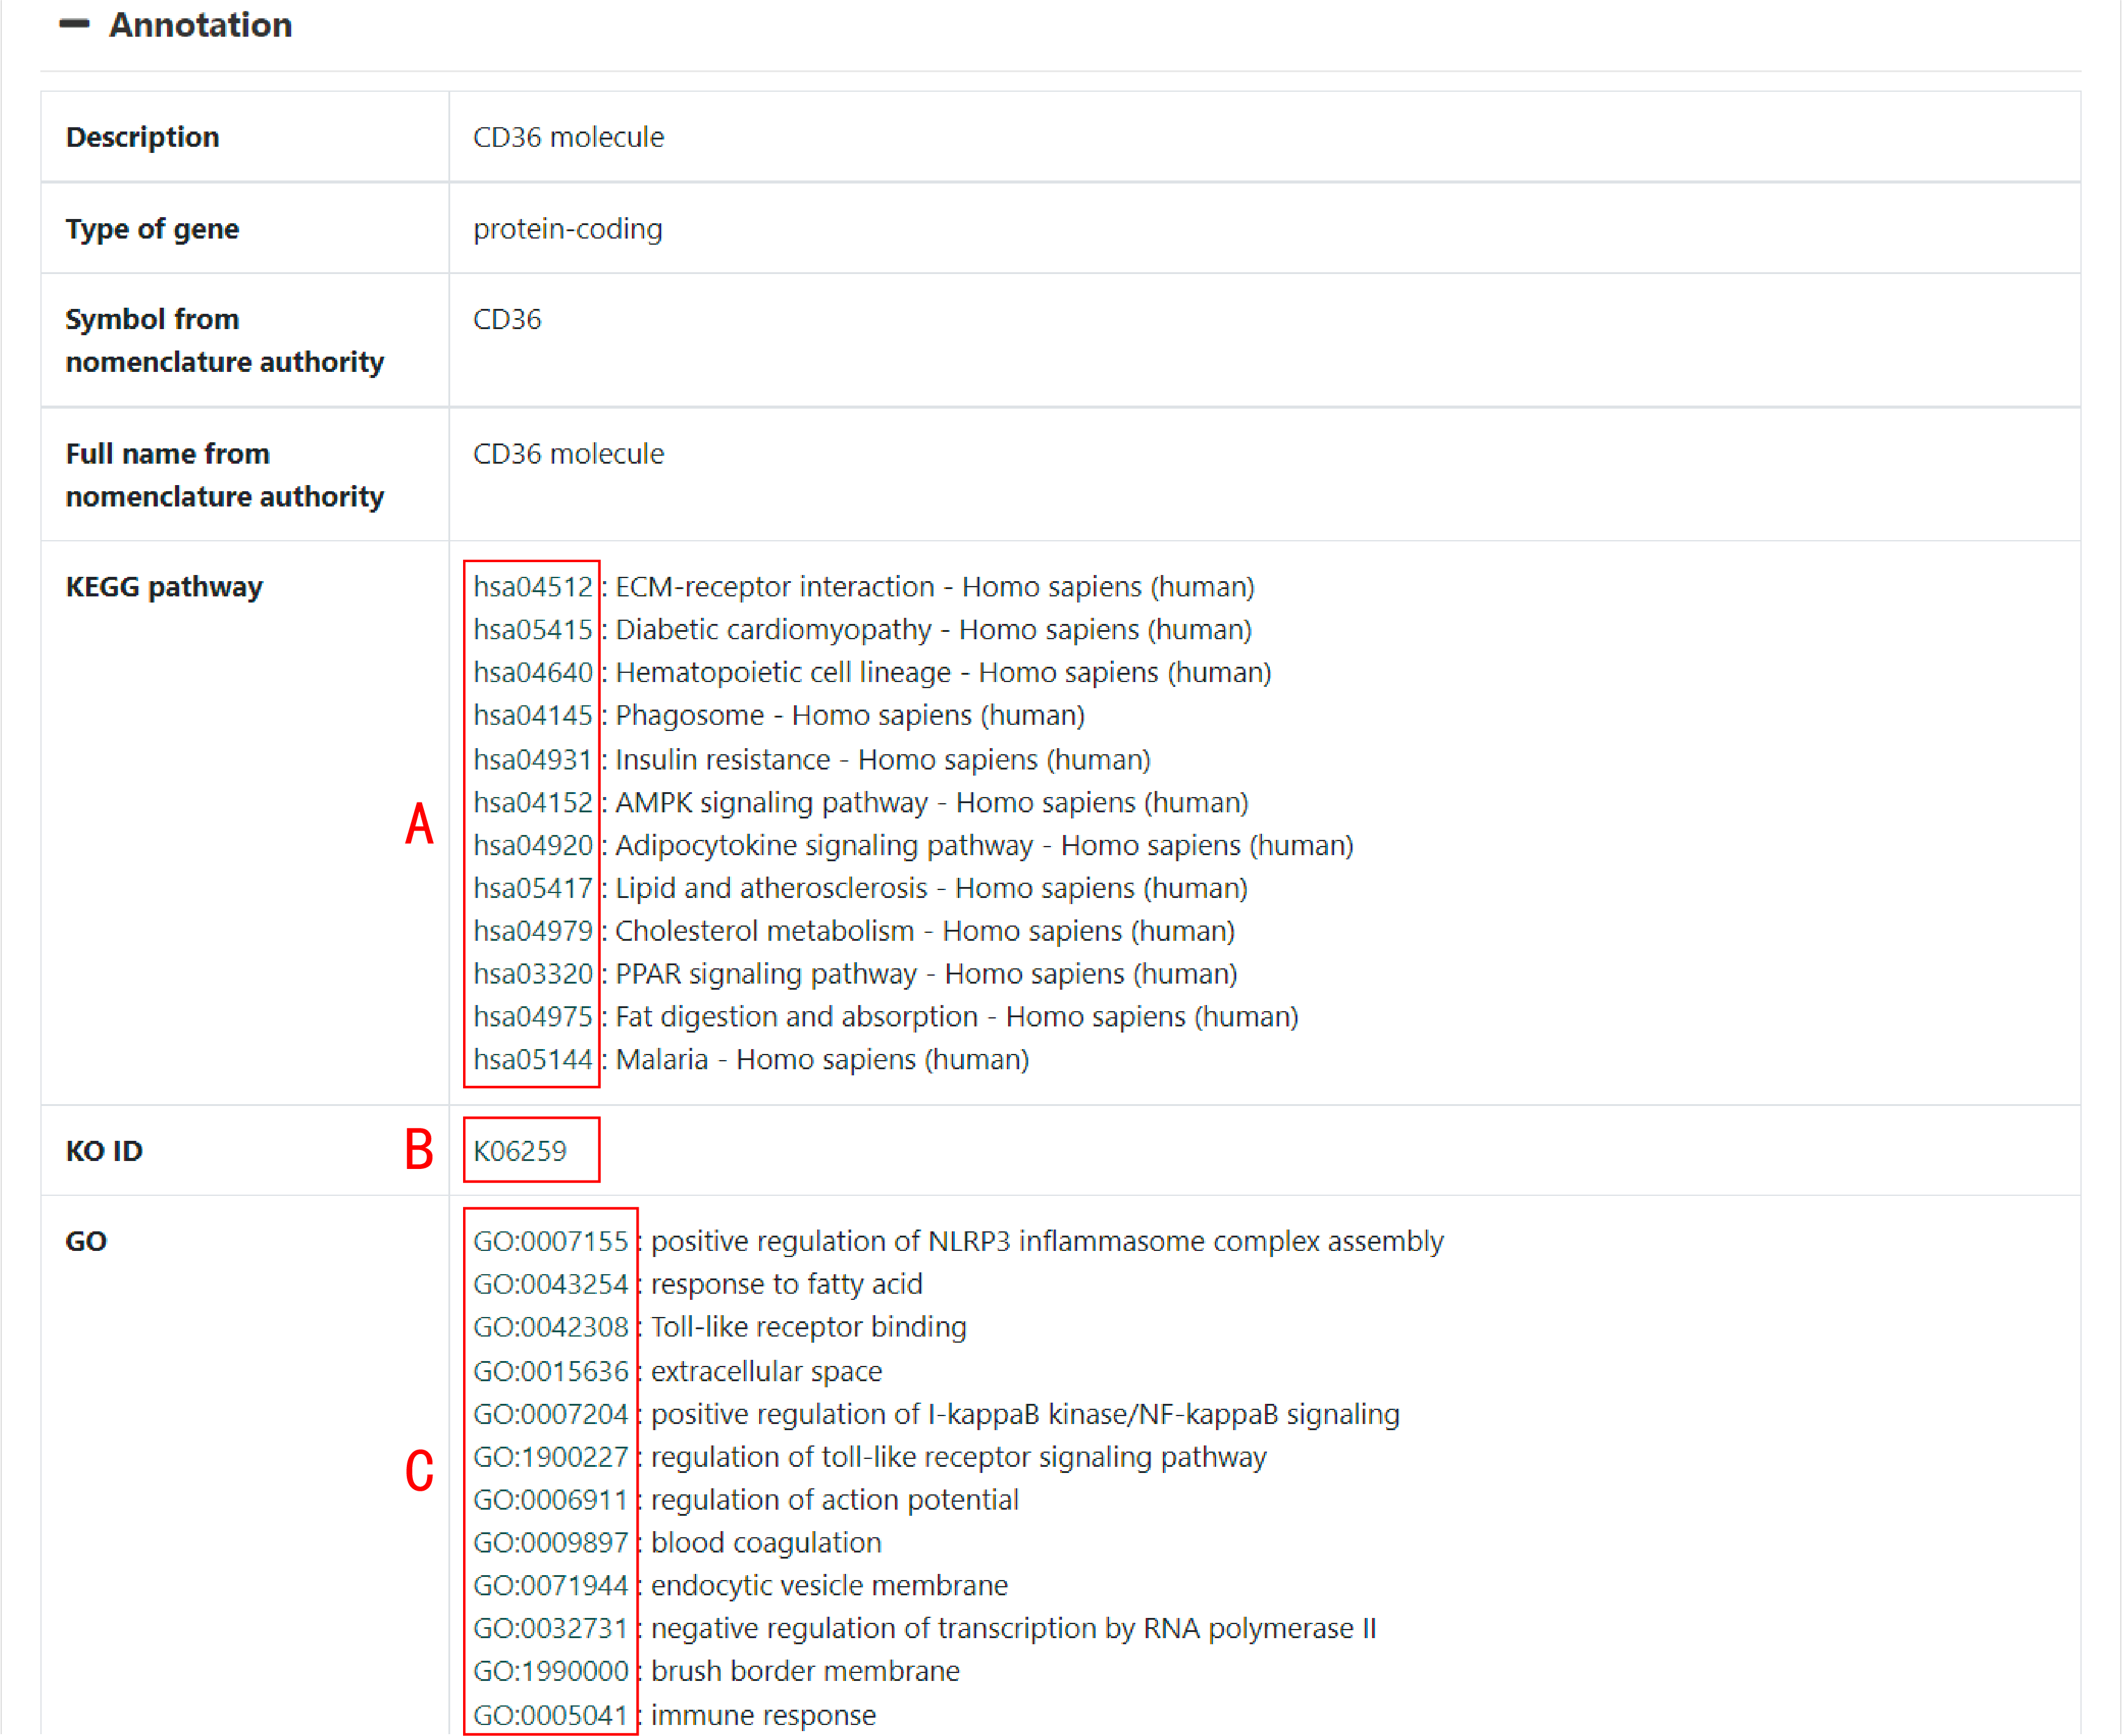
Figure 3.Some annotations of one gene
This part includes some annotations of one gene. The content is shown in the table header. KEGG pathway (Figure 3A) links to KEGG database. KO ID(Figure 3B) and GO(Figure 3C) are same as to KEGG pathway (Figure 3A) linking to KEGG database and GO database.
Block
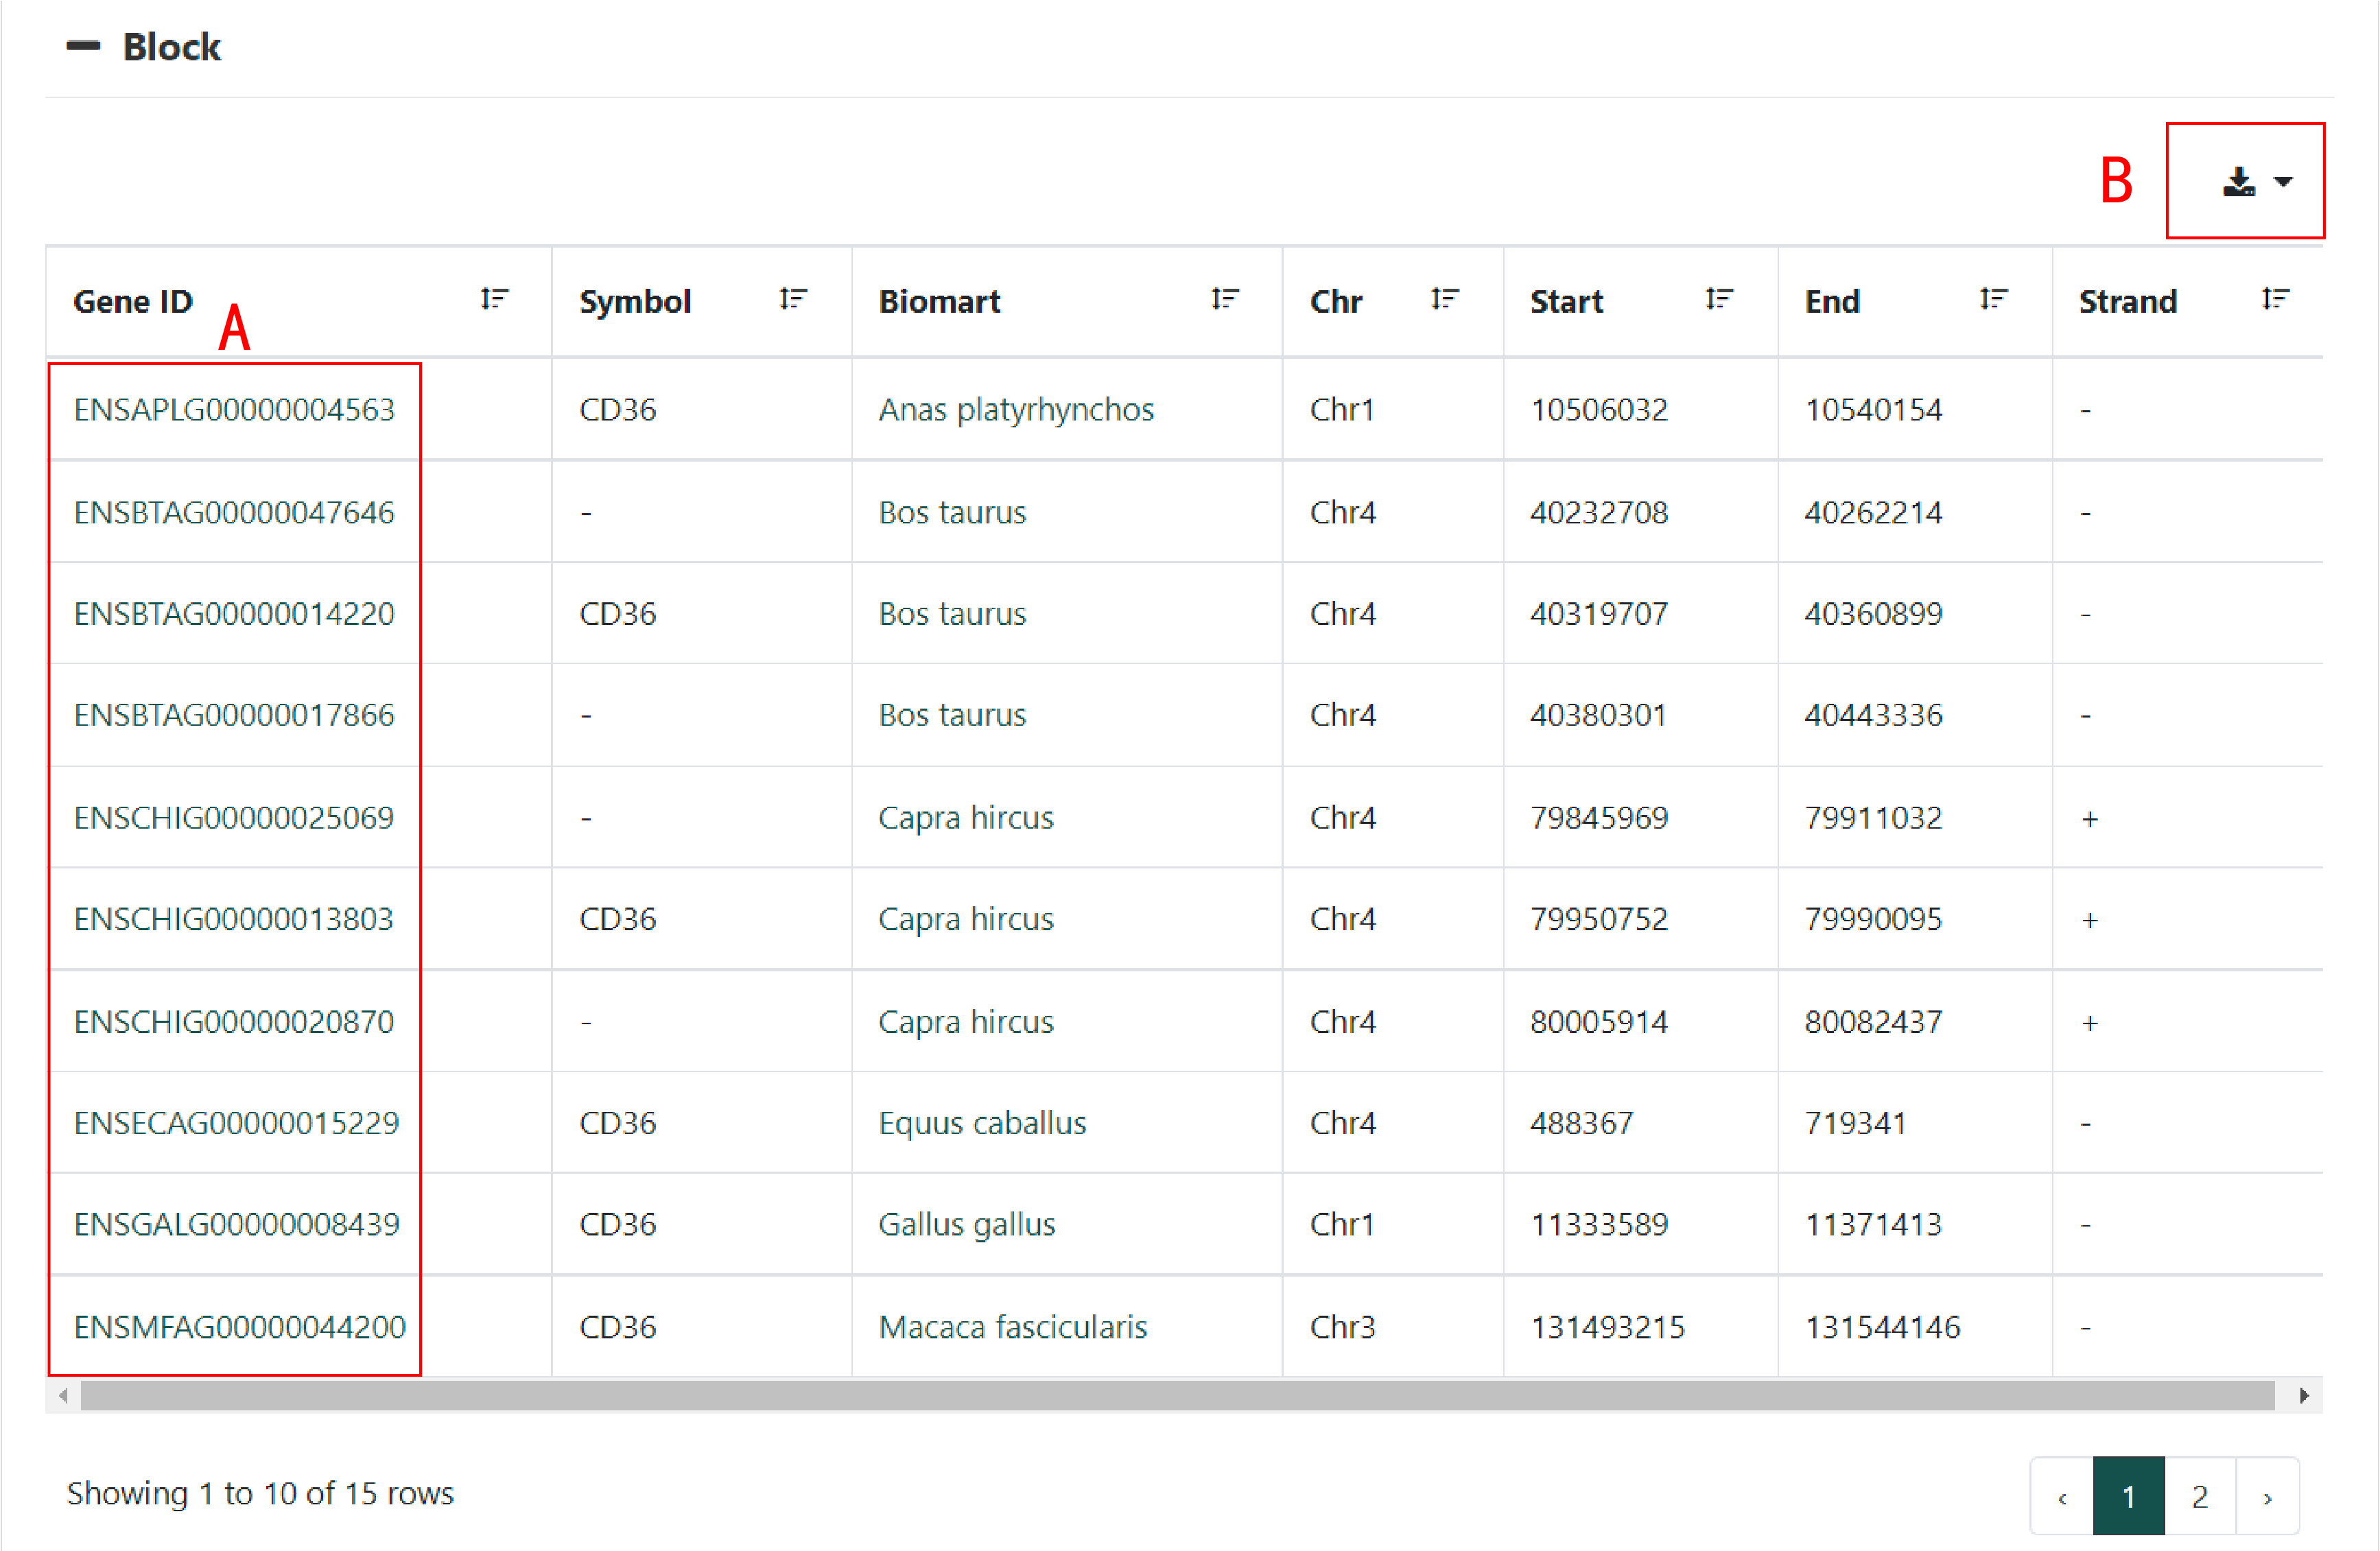
Figure 4.Table of genes of homologous from Biomart.
This part show a table of genes of homologous from Biomart. Gene ID(Figure 4A) links to the homologous gene. Clicking the icon(Figure 4B) can export this table in a variety of file formats.
RNA-seq
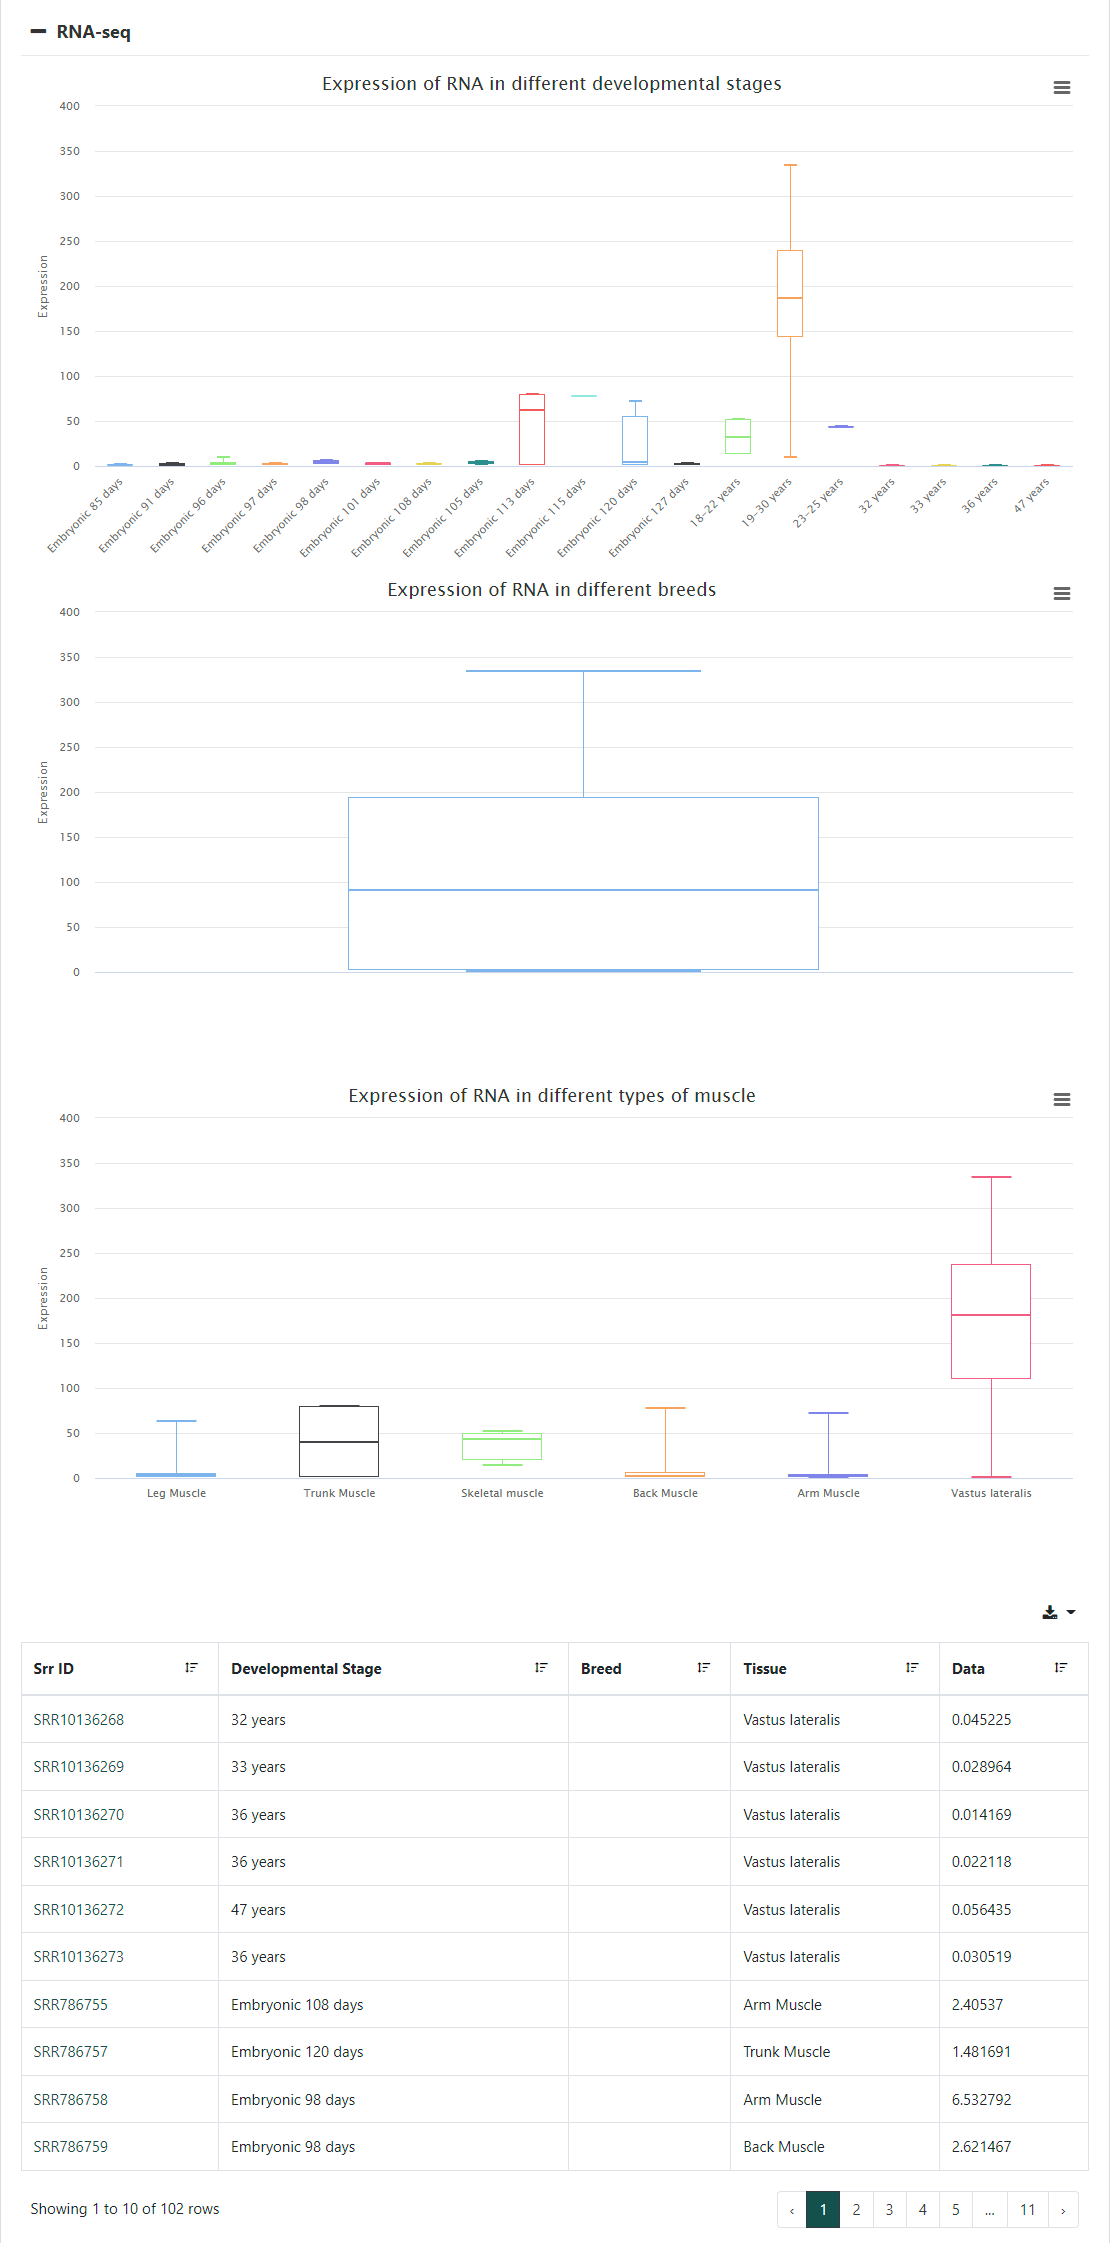
Figure 5.Box plots and table of RNA-seq data
This part includes three plots and one table of RNA-seq about this gene.
In Expression of RNA in different developmental stages box plot, the x-axis is sorted in chronological order of development and the y-axis is the expression. This plot shows trends in gene expression over time of development.
In Expression of RNA in different breeds box plot, the x-axis is of different breeds of this specie and the y-axis is the expression. This plot compares the expression of this gene in different breeds.
In Expression of RNA in different types of muscle box plot, the x-axis is of different types of muscle and y-axis is the expression. This plot compares the expression of this gene in different types of muscle.
The table shows expression of this gene in different biosamples with simple information of these biosamples.
Target miRNA-seq
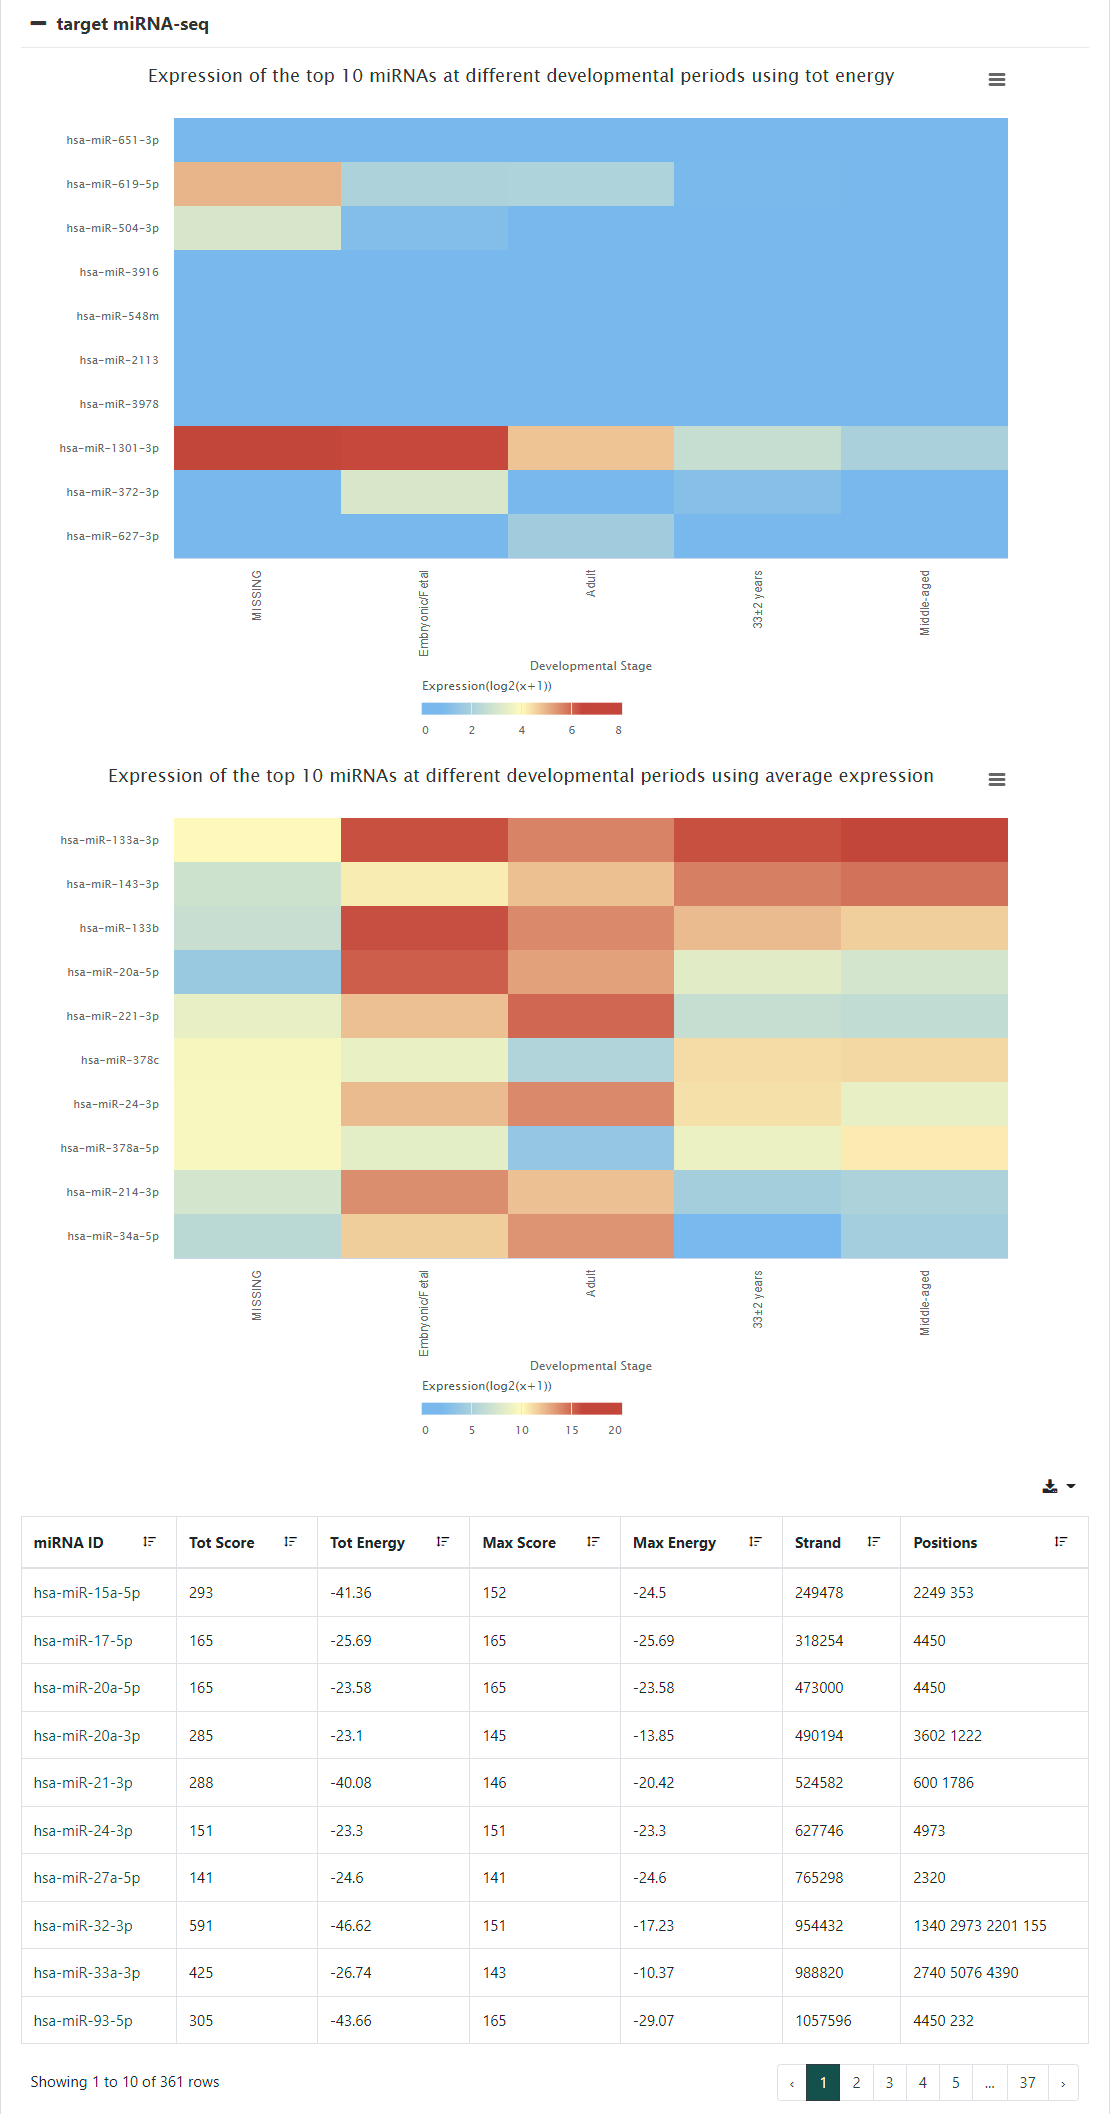
Figure 6.Heatmaps and table of target miRNA-seq
This part includes two heatmaps and one table of target miRNA-seq about this gene. All target miRNAs were predicted and selected by our standard process.
In Expression of the top ten miRNAs at different developmental periods using tot energy heatmap,the x-axis is sorted in chronological order of development and the y-axis is the top ten miRNAs using tot energy and the color of cell represents the amount of expression.
In Expression of the top ten miRNAs at different developmental periods using average expression heatmap, the x-axis is sorted in chronological order of development and y-axis is the top ten miRNAs using average expression and the color of cell represents the amount of expression.
The table shows all target miRNAs of this gene with some information about miRNAs.
ATAC-seq & ChIP-seq & MeRIP-seq
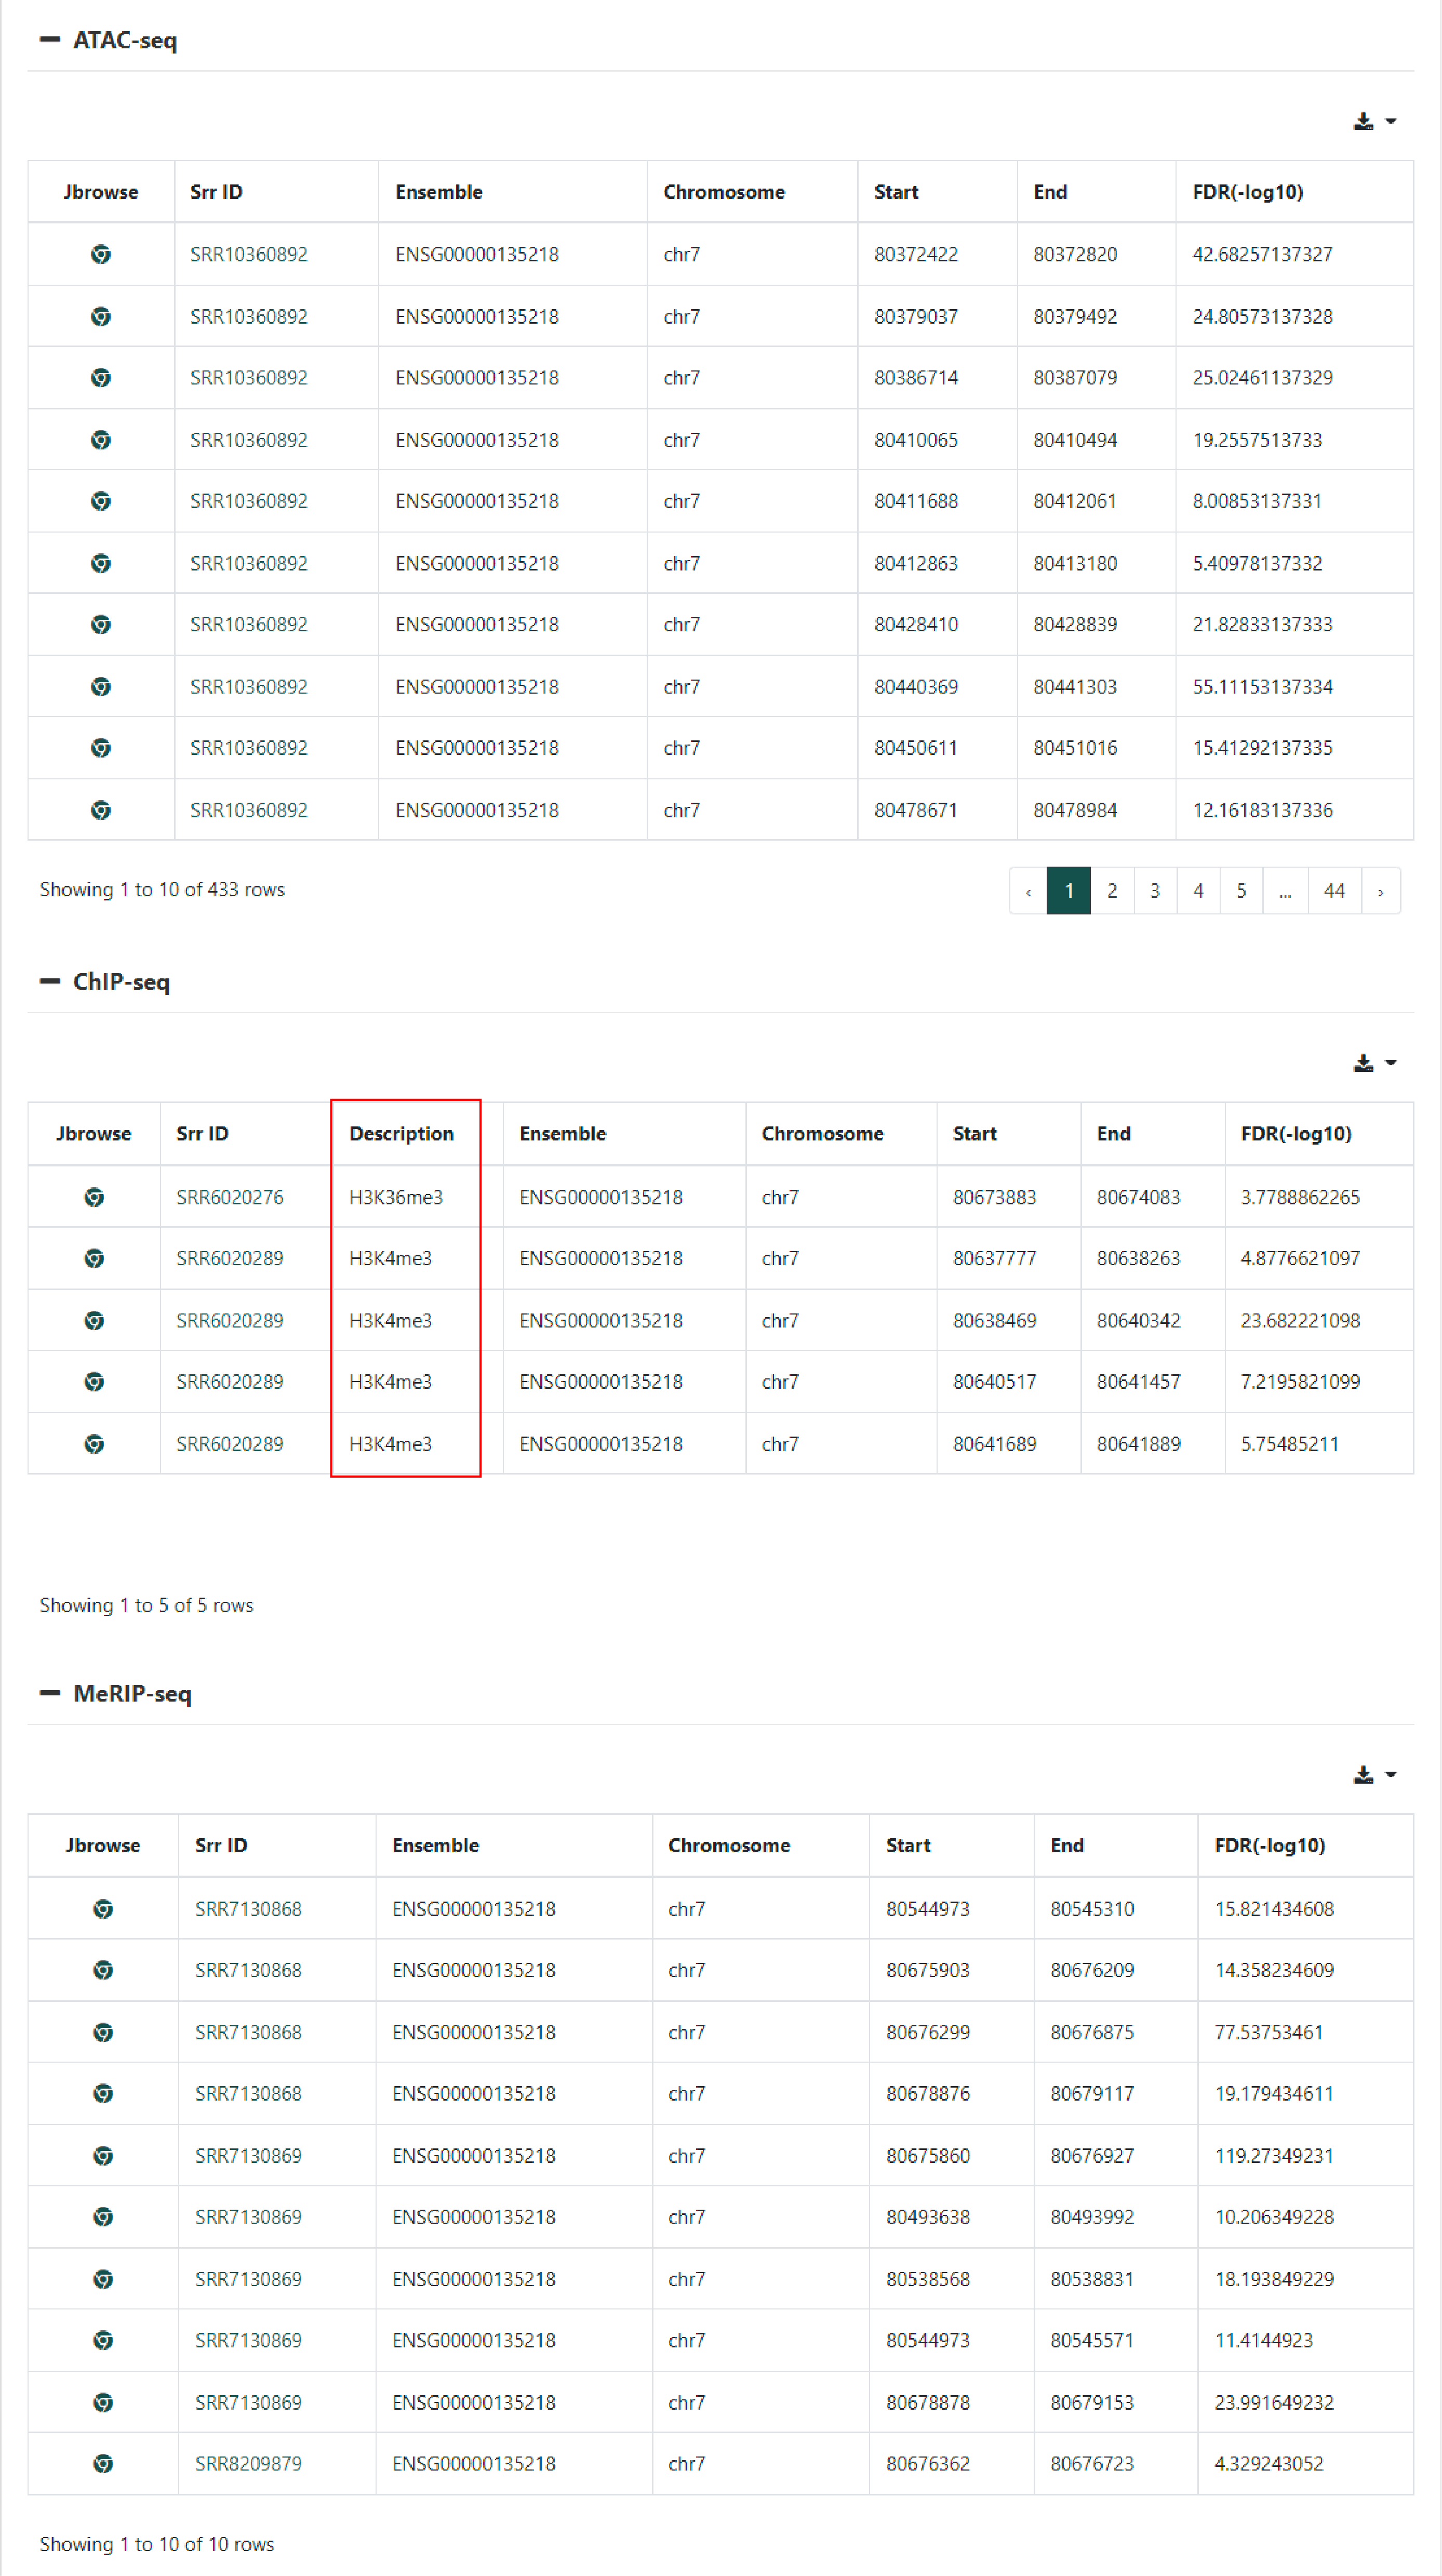
Figure 7.Table of identified peaks
Each of these parts includes one table of identified peaks in that omics with information about peaks. All these peaks overlap with this gene. Jbrowse links to Genome browser page of this specie window of which locates the gene in the genome and explores this biosample in Genome browser.
WGBS/RRBS
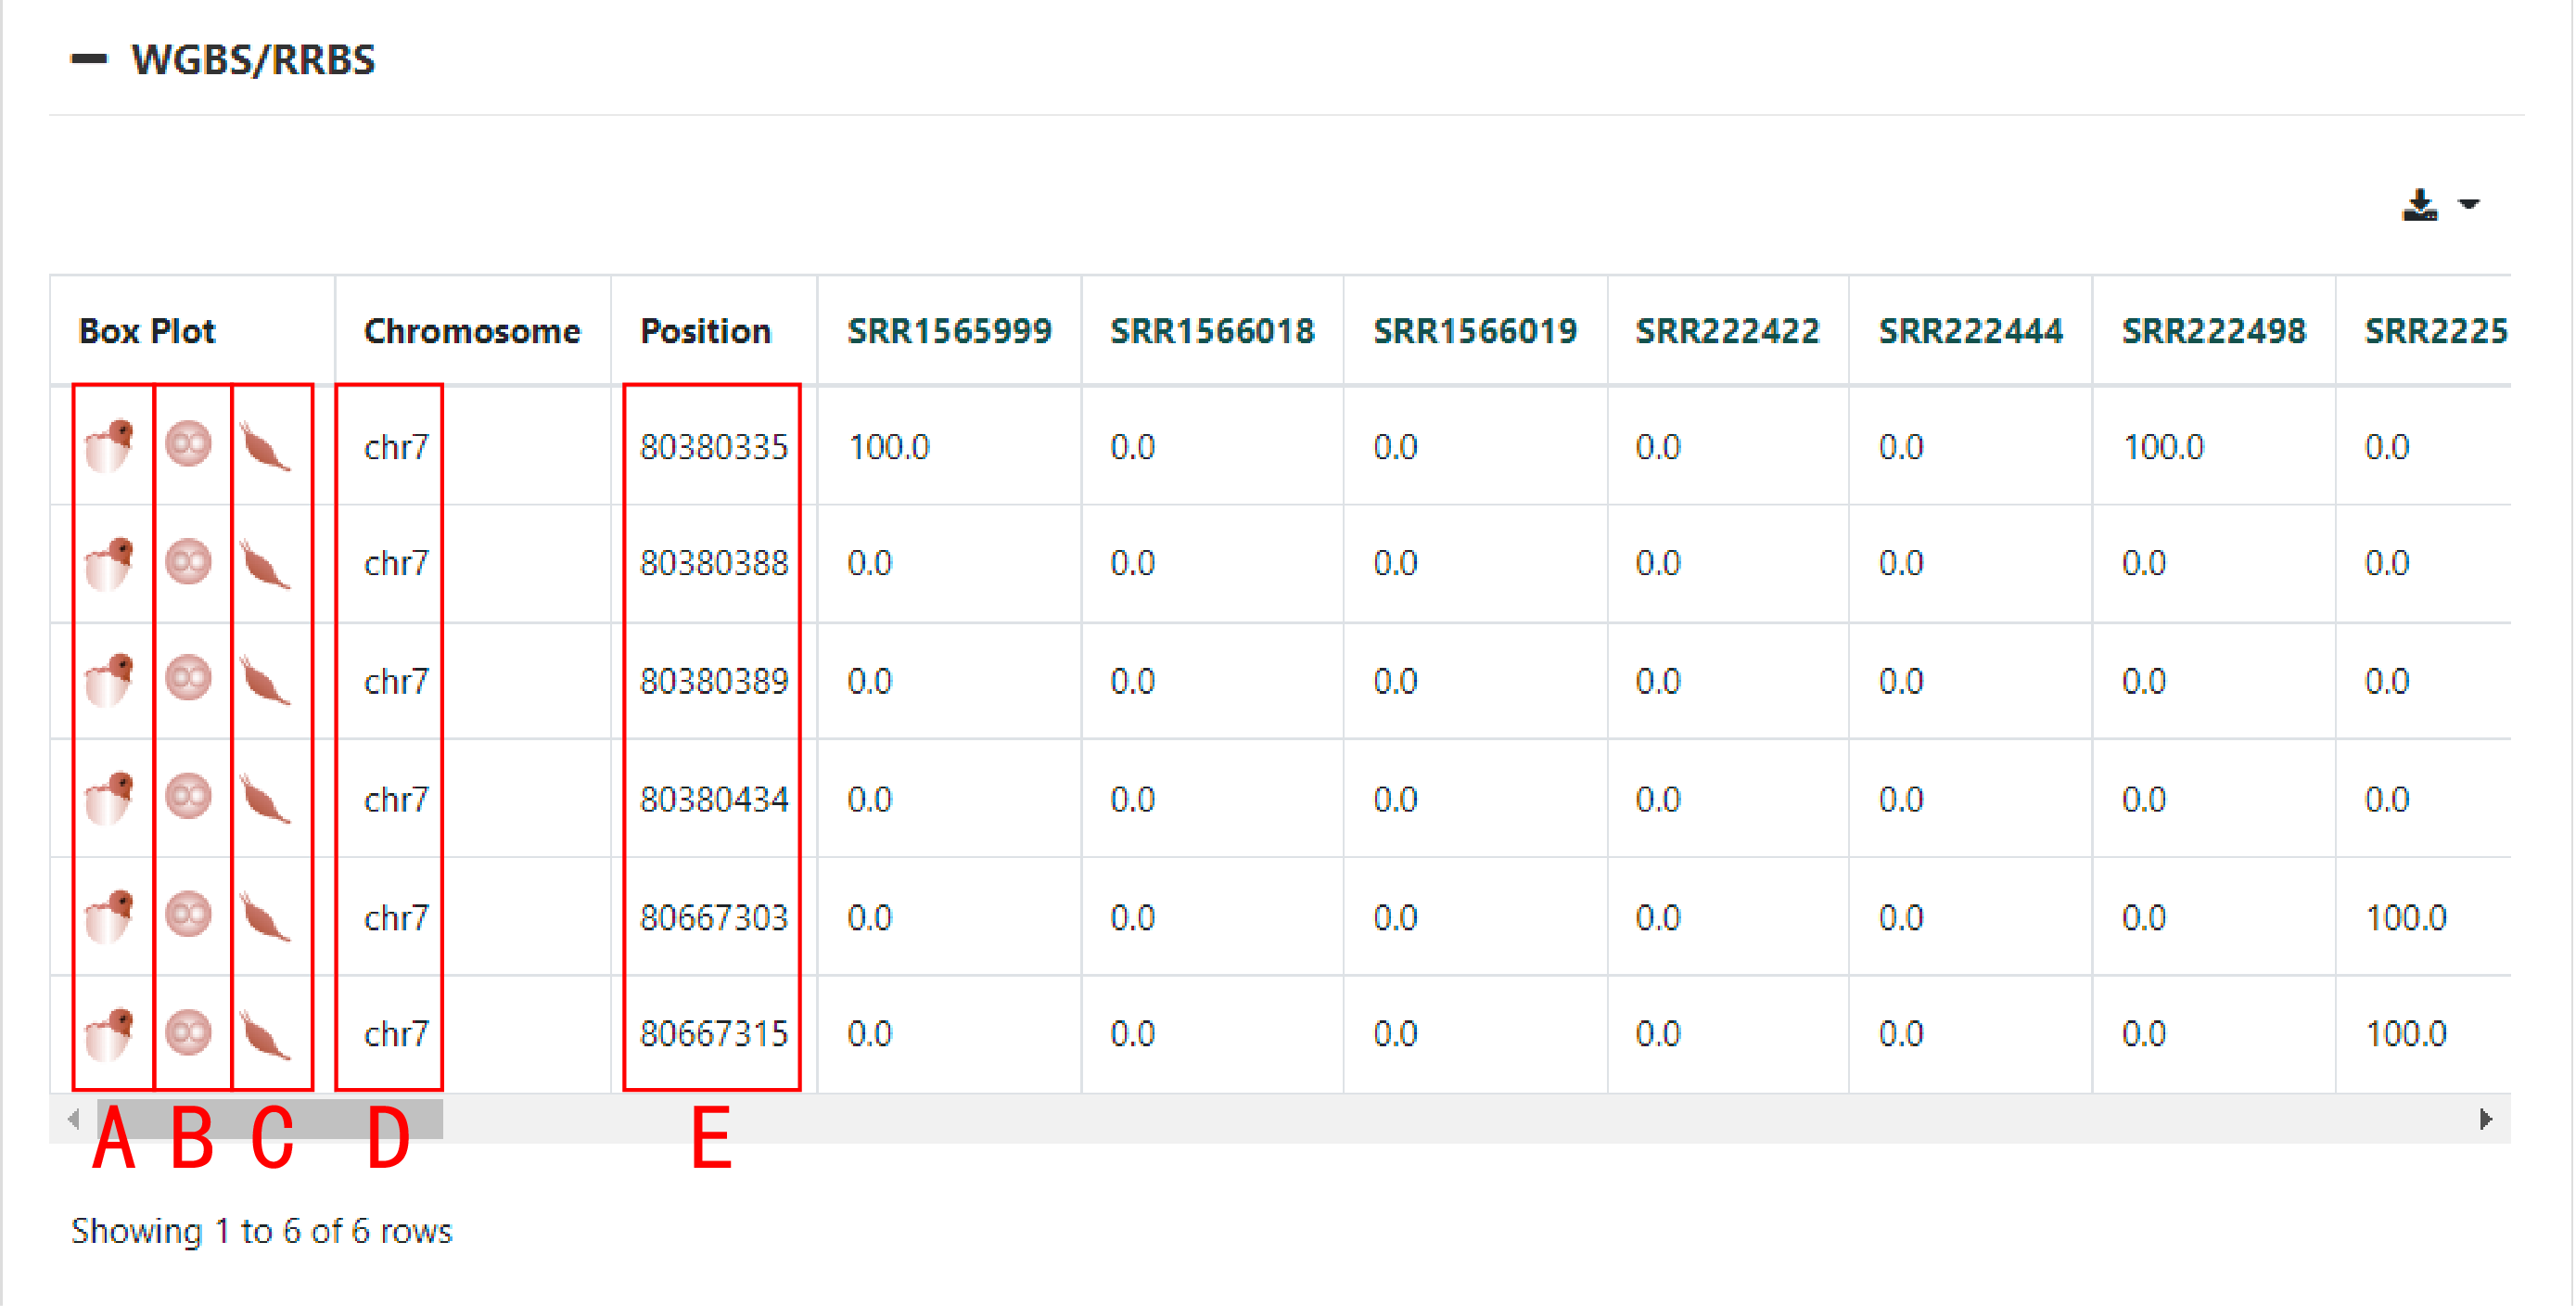
Figure 8.Table of identified methylation site
This part includes three plots and one table of identified methylation site, Chromosome(Figure 8D) and Position(Figure 8E) show the location of identified methylation sites. All these sites overlap with this gene in the genome.
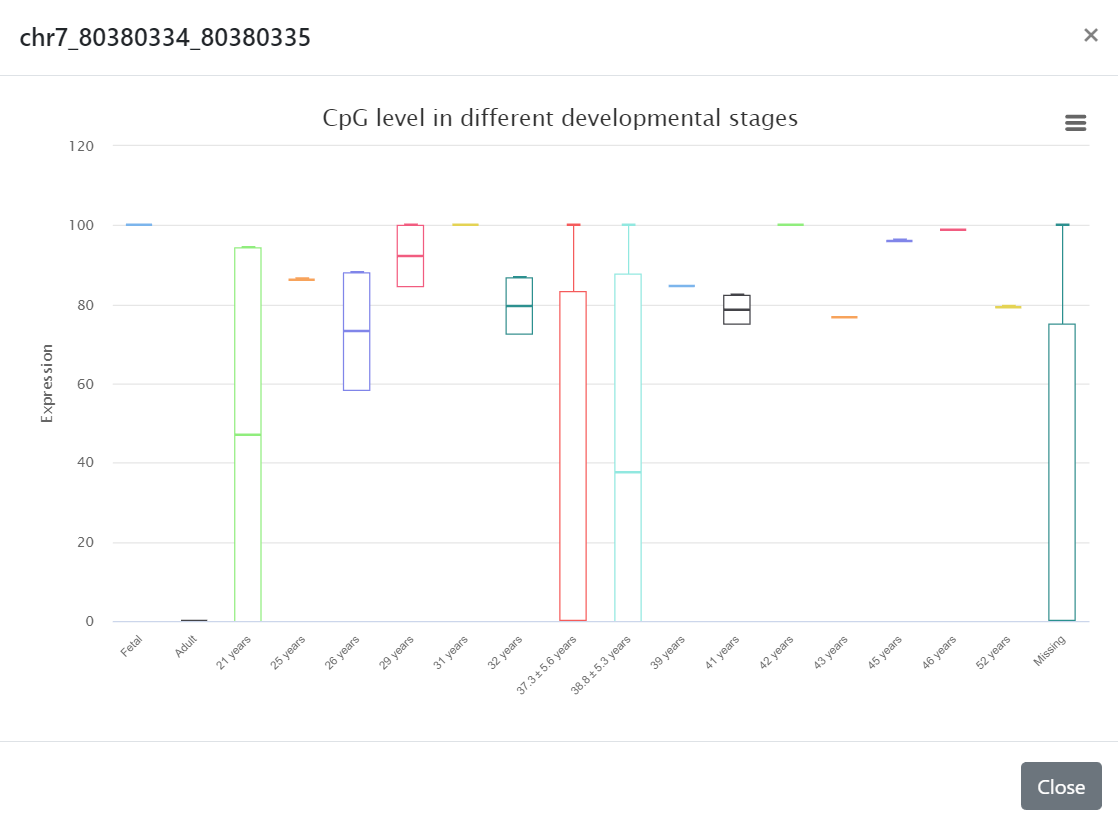
Figure 9.CpG level in different development stages box plot
The icon(Figure 8A) links to CpG level in different development stages box plot. This plot shows the CpG level of this site in different development stages.
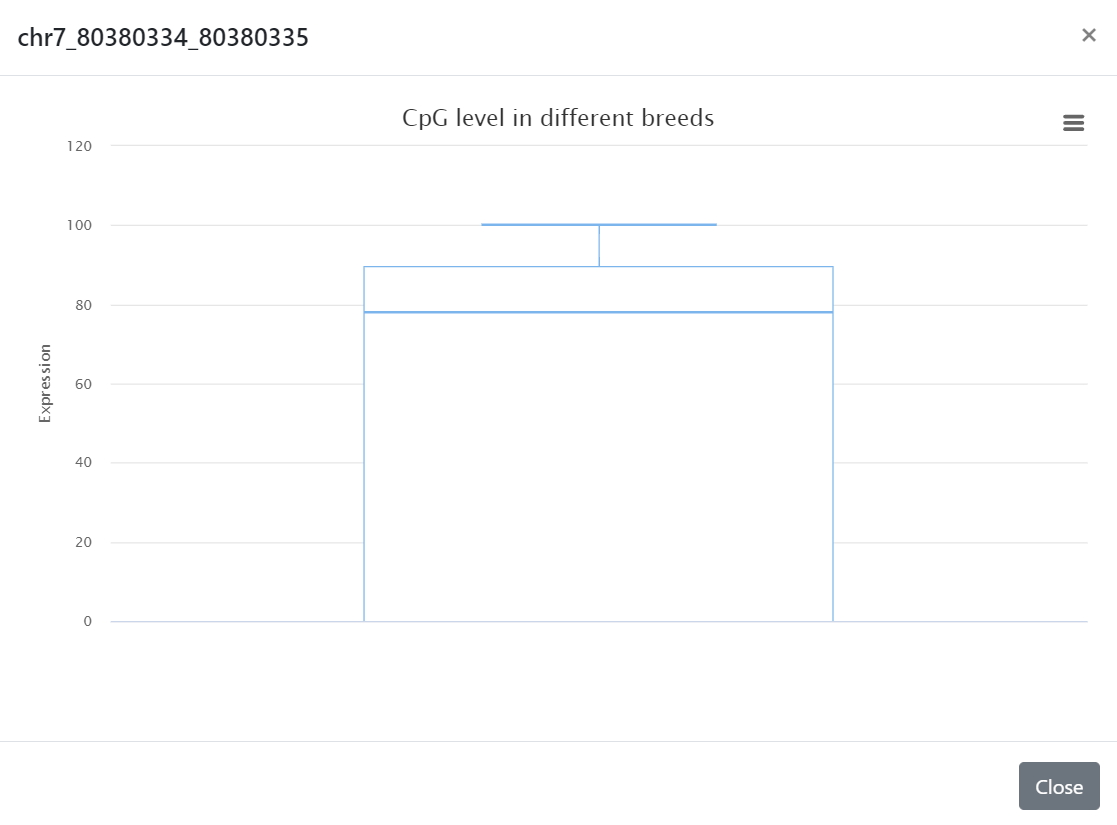
Figure 10.CpG level in different breeds box plot
The icon(Figure 8B) links to CpG level in different breeds box plot. This plot compares
the CpG level of this site in different breeds.
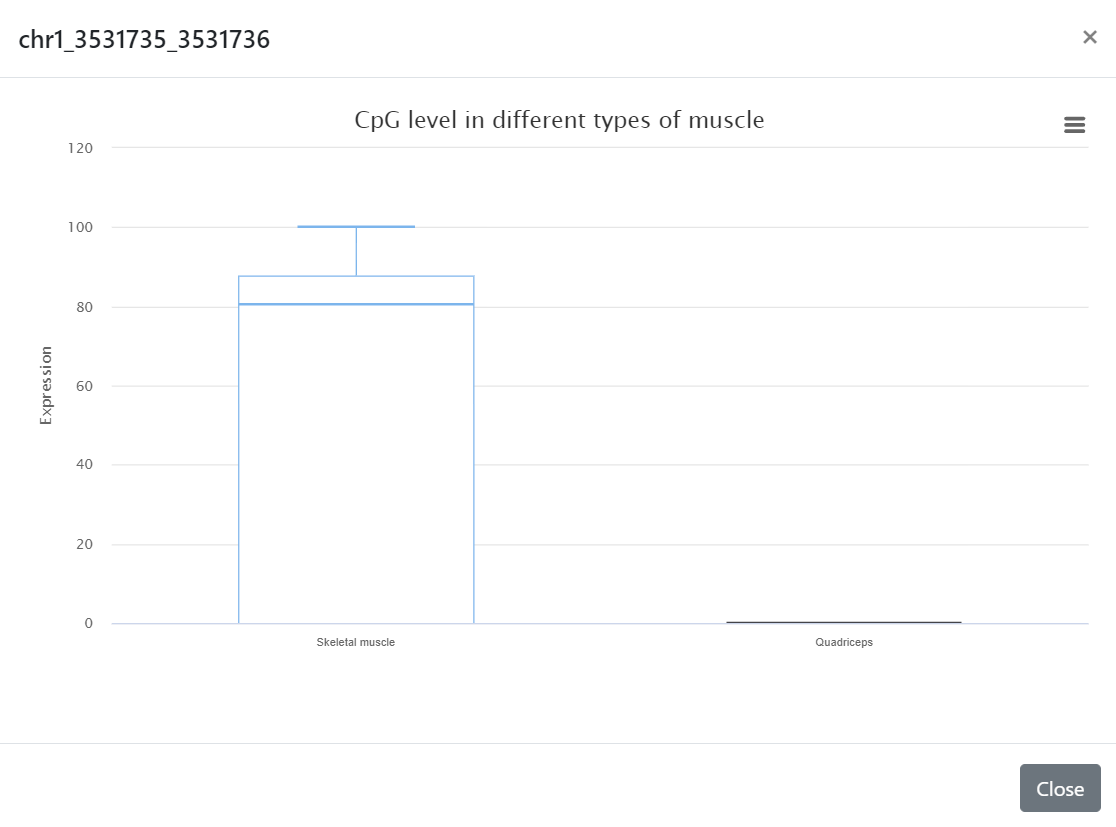
Figure 11.CpG level in different types of muscle box plot
The icon(Figure 8C) links to CpG level in different types of muscle box plot. This plot compares
the CpG level of this site in different types of muscle.